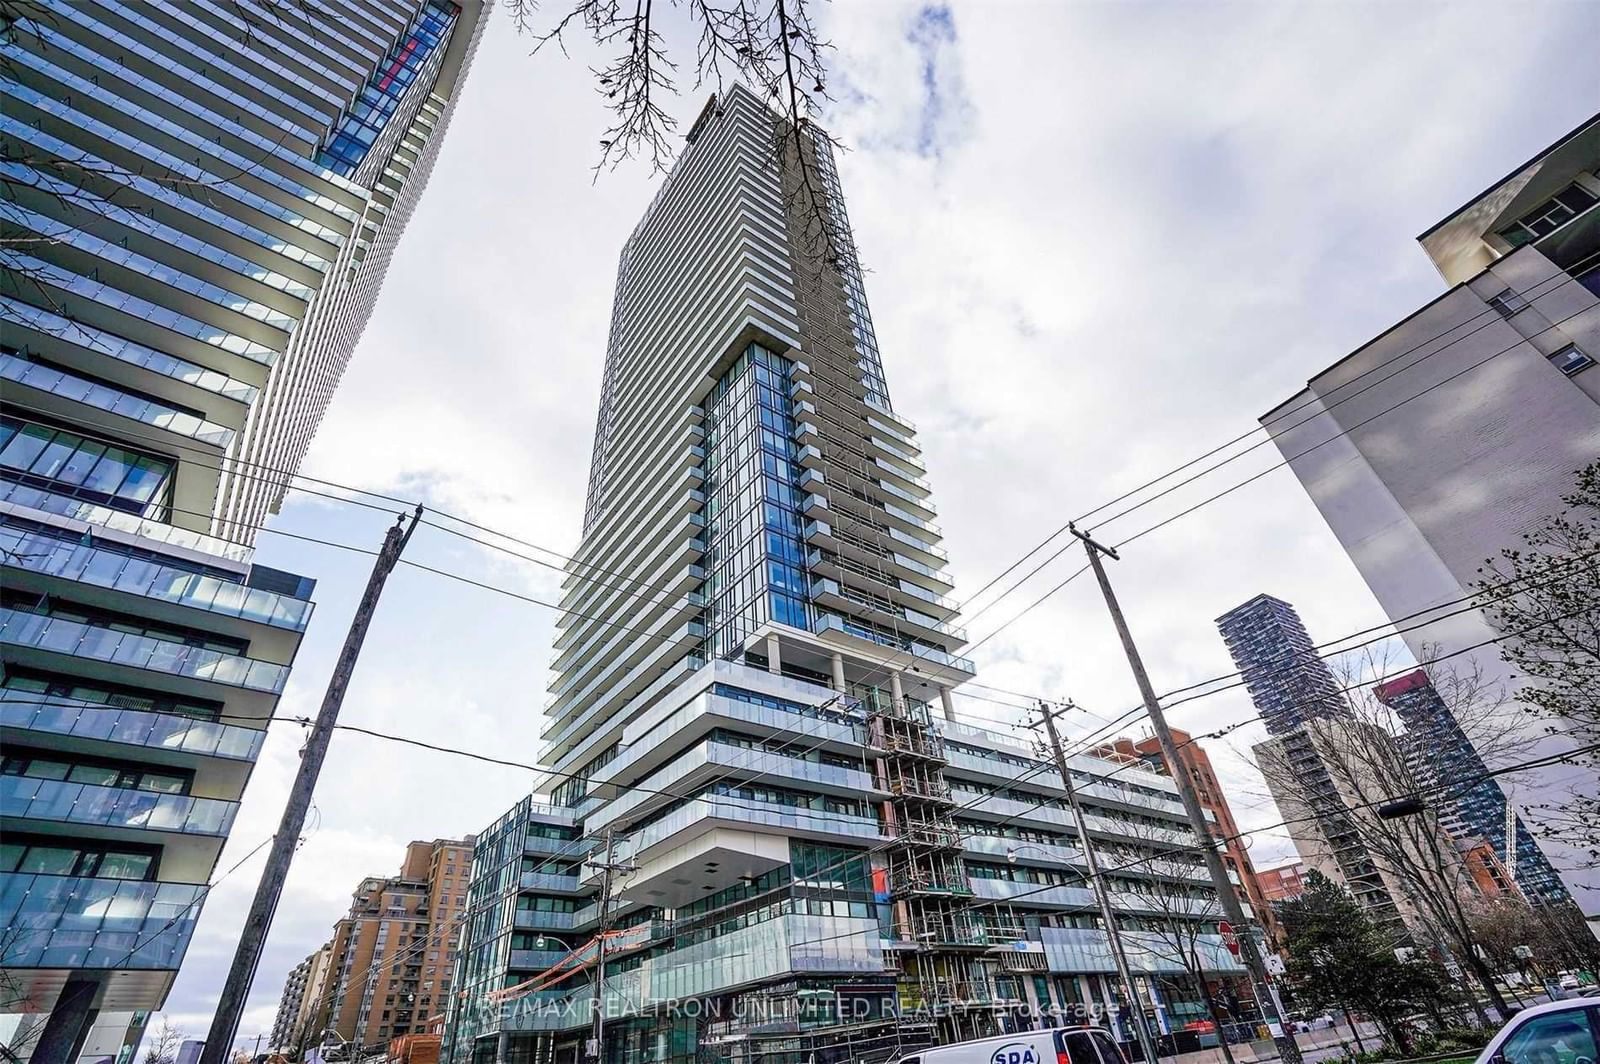
3503 - 161 Roehampton Ave
Listing History
Unit Highlights
Utilities Included
Utility Type
- Air Conditioning
- Central Air
- Heat Source
- Gas
- Heating
- Forced Air
Room Dimensions
About this Listing
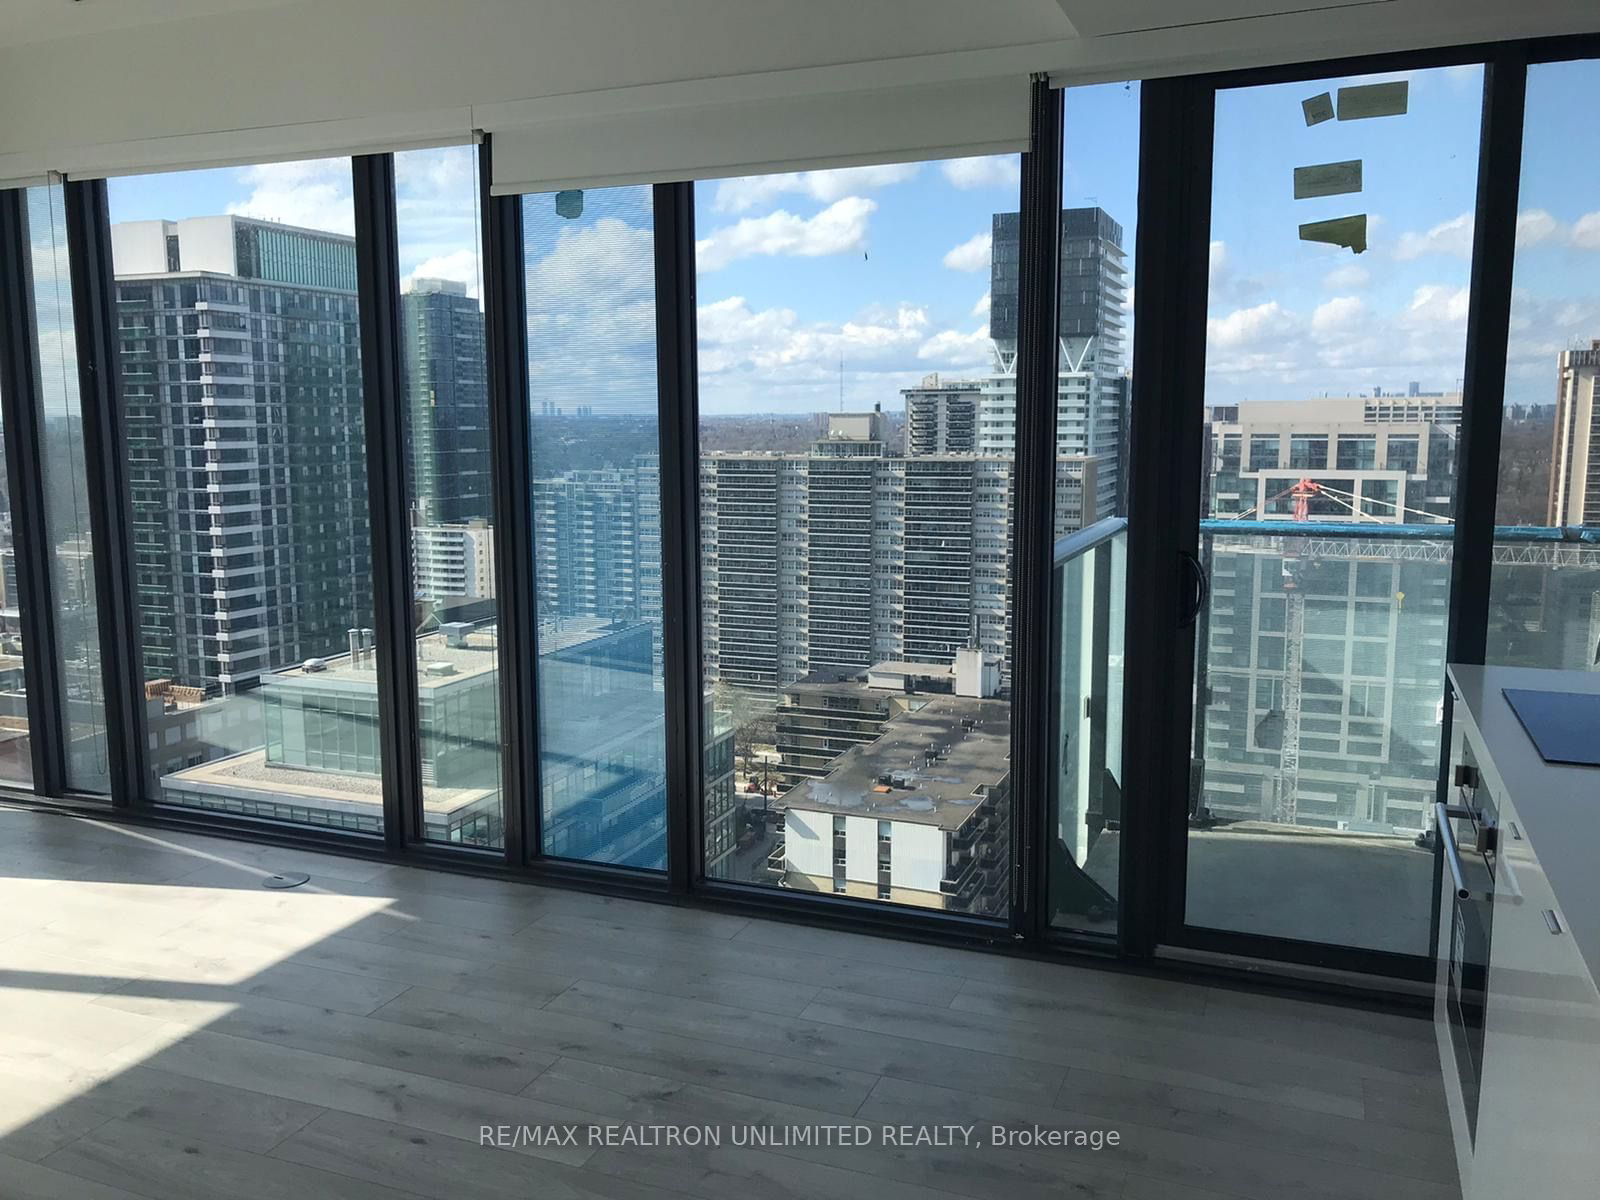
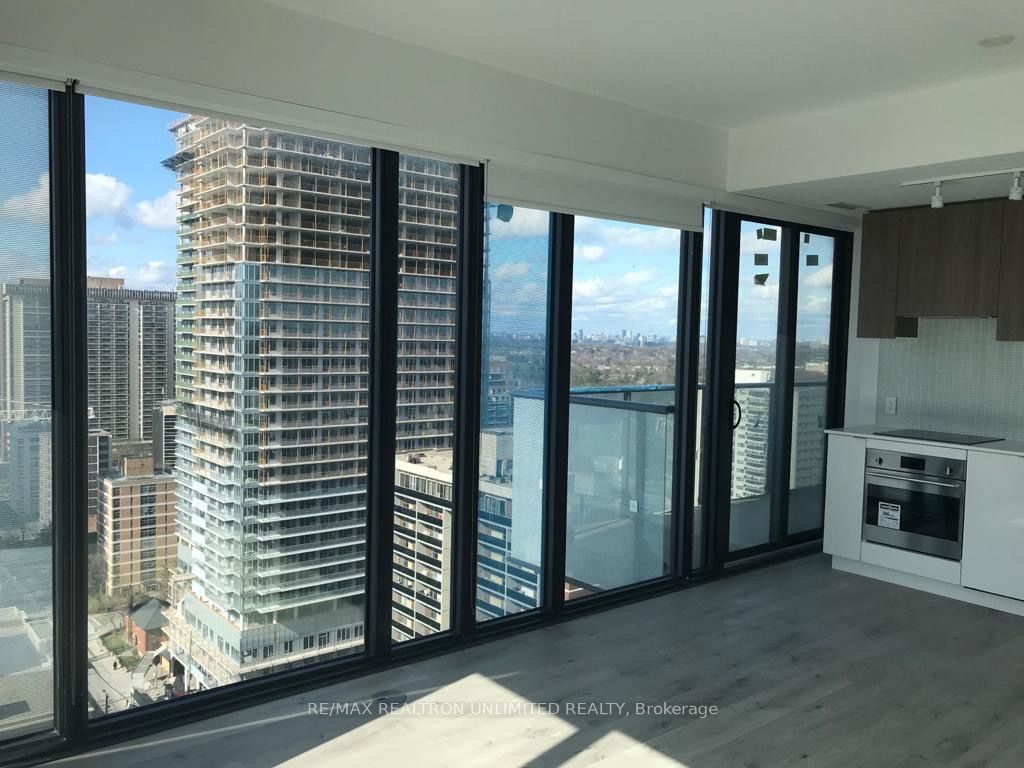
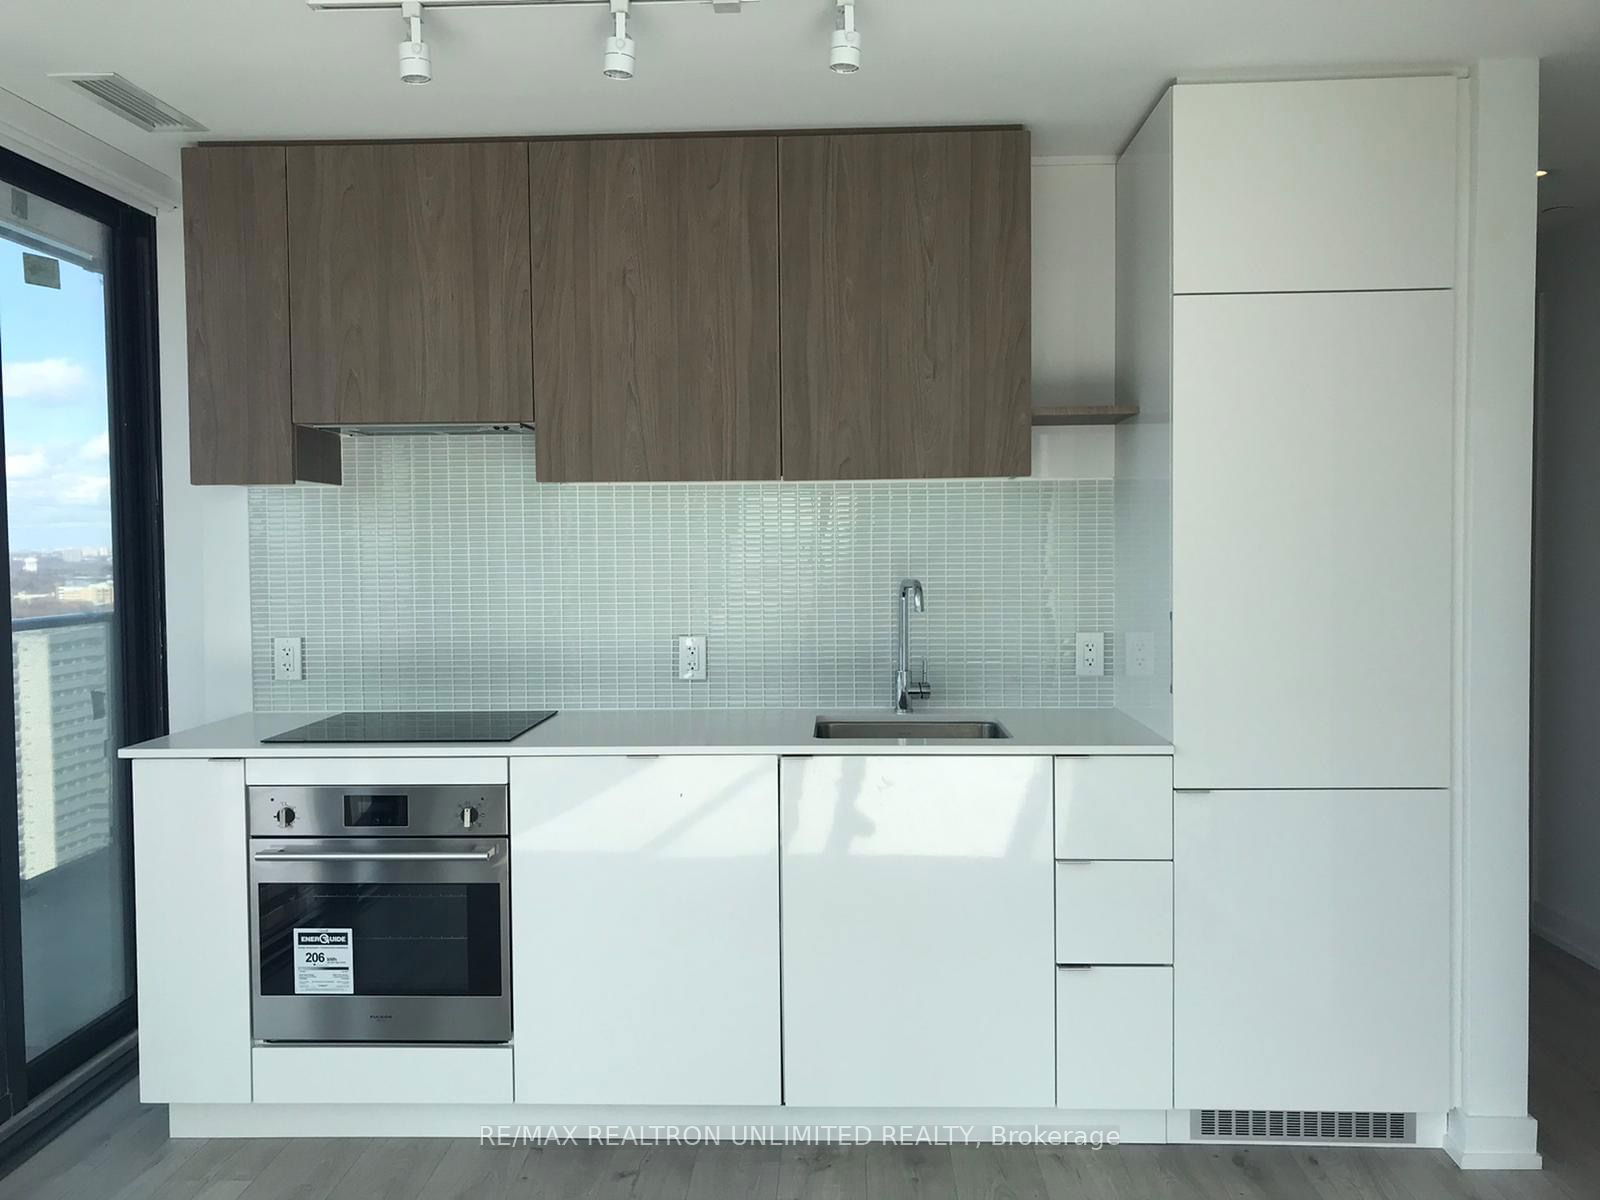
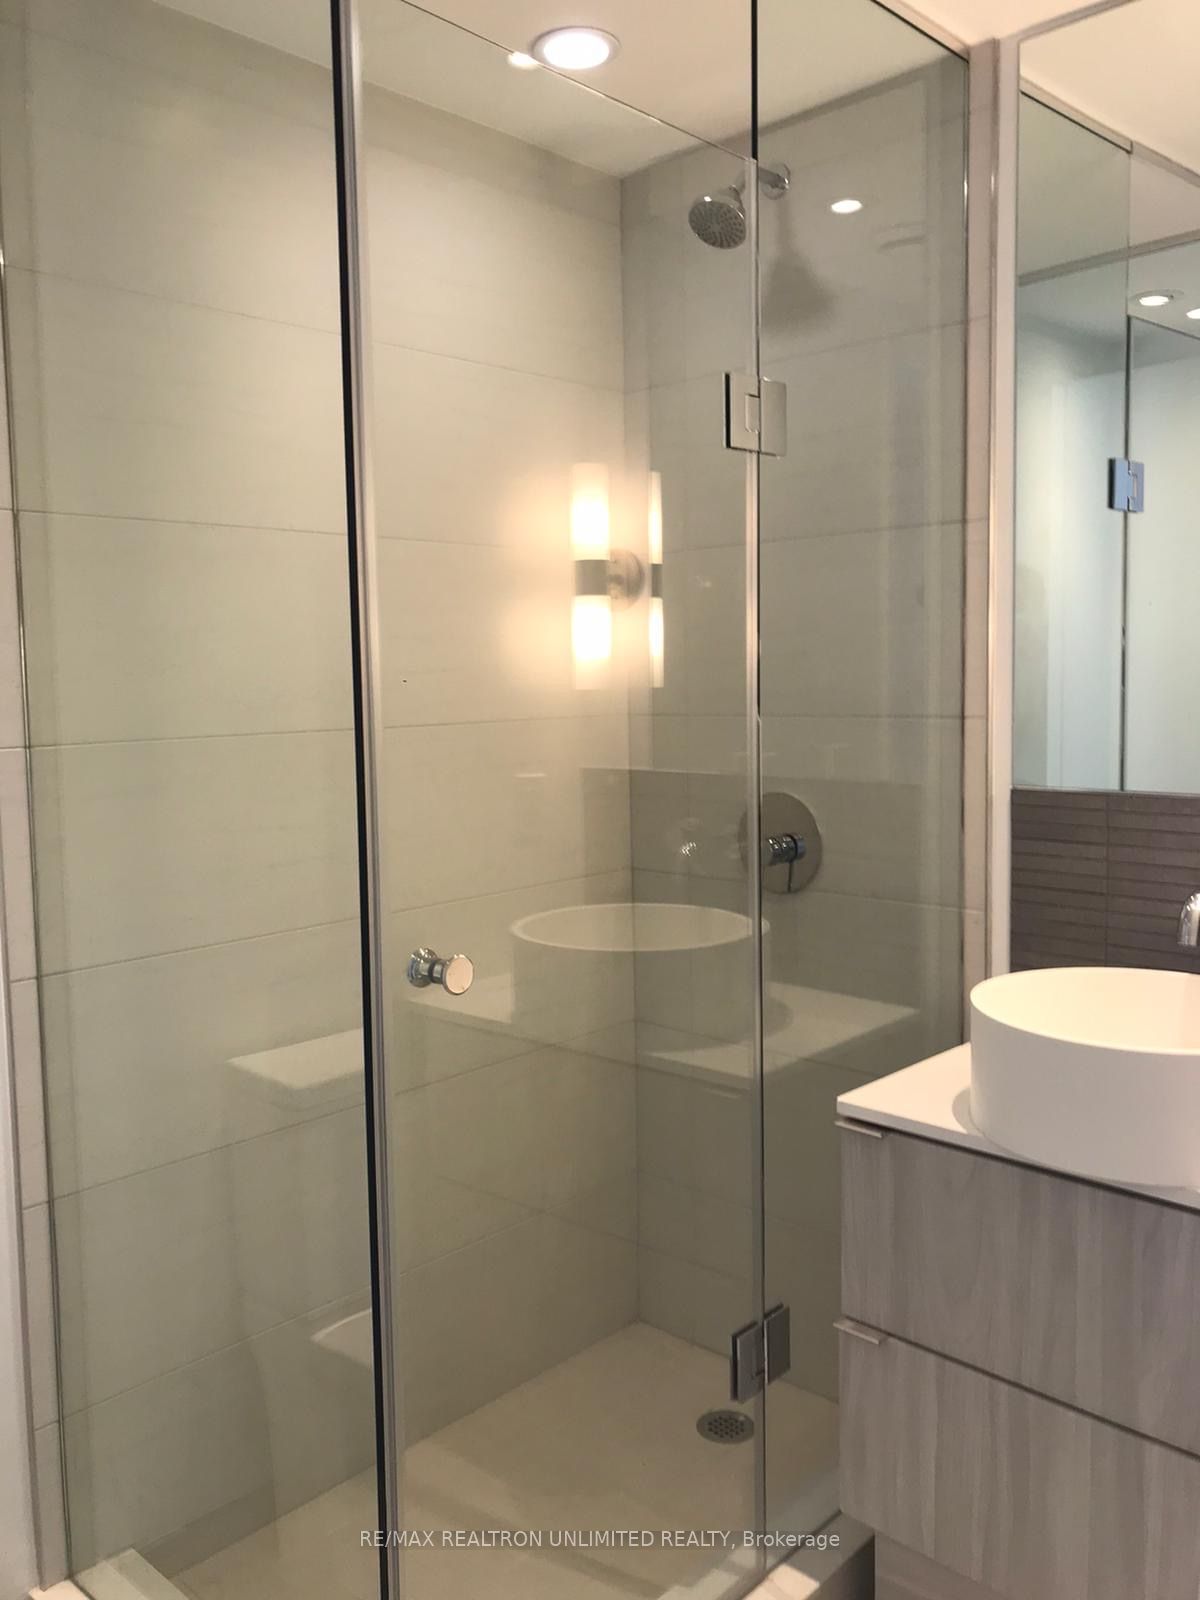
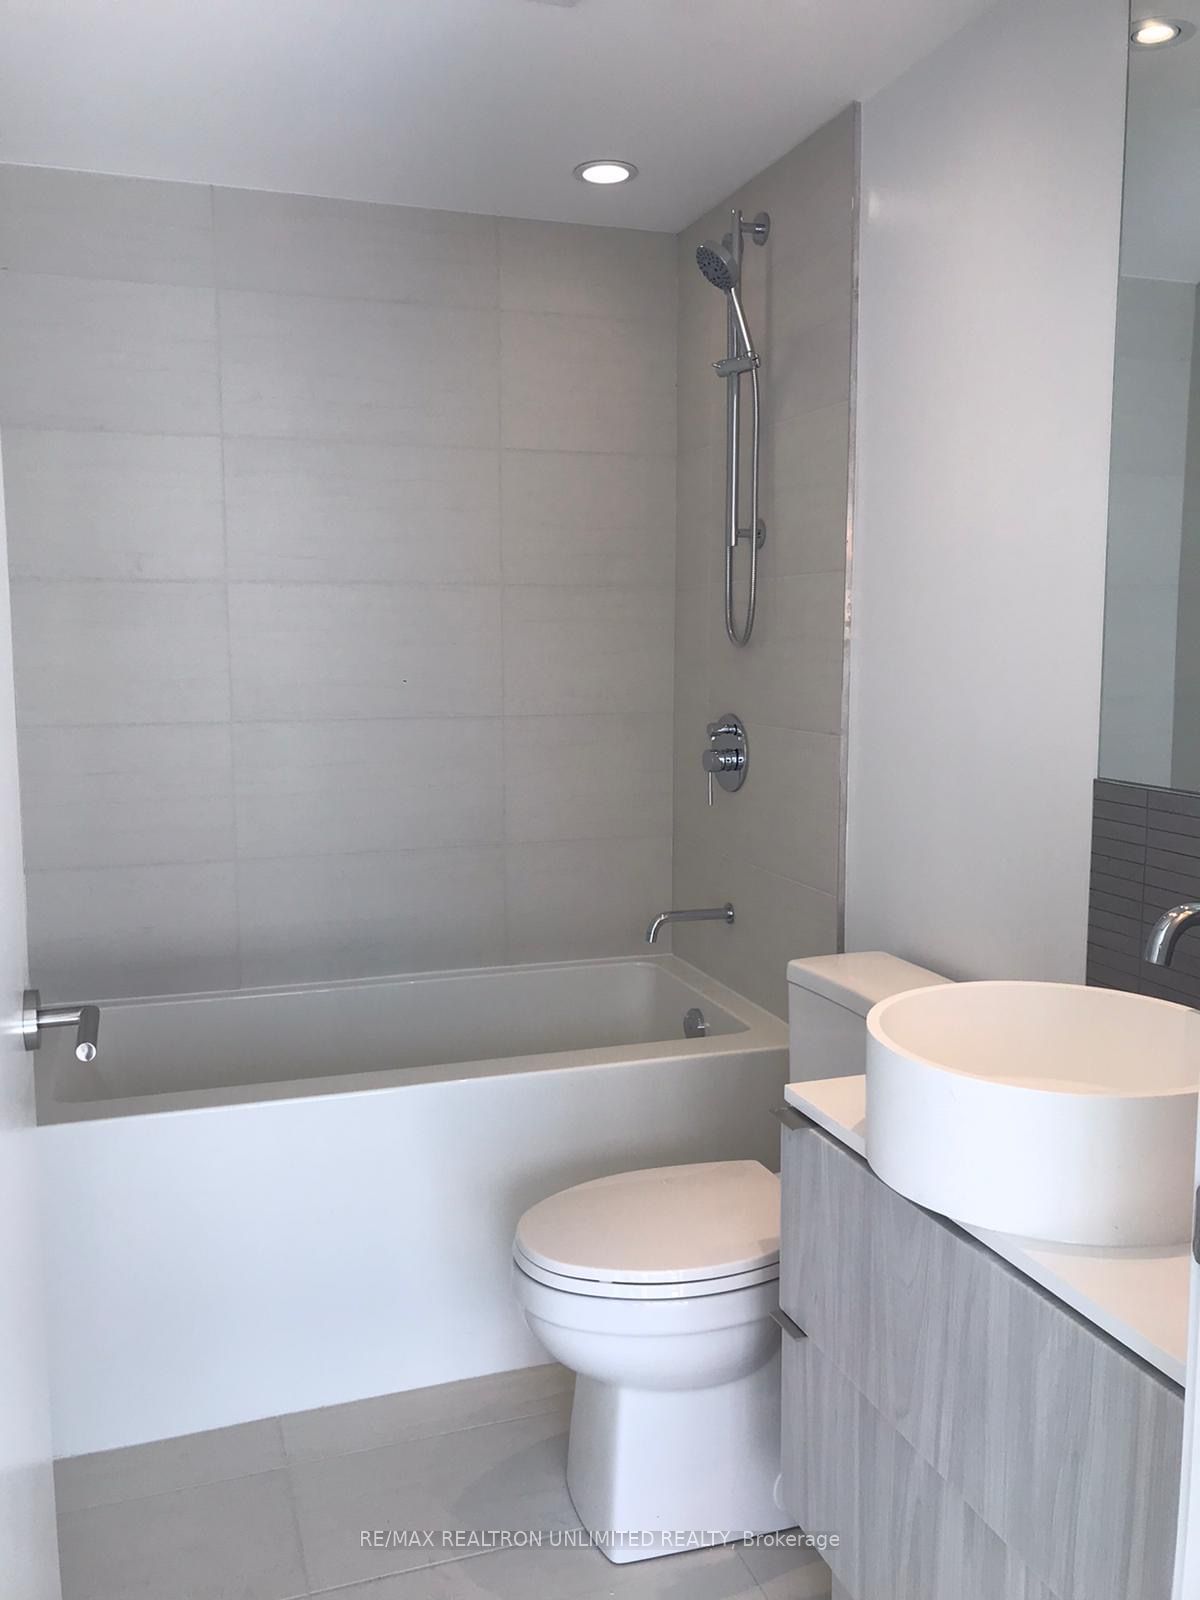
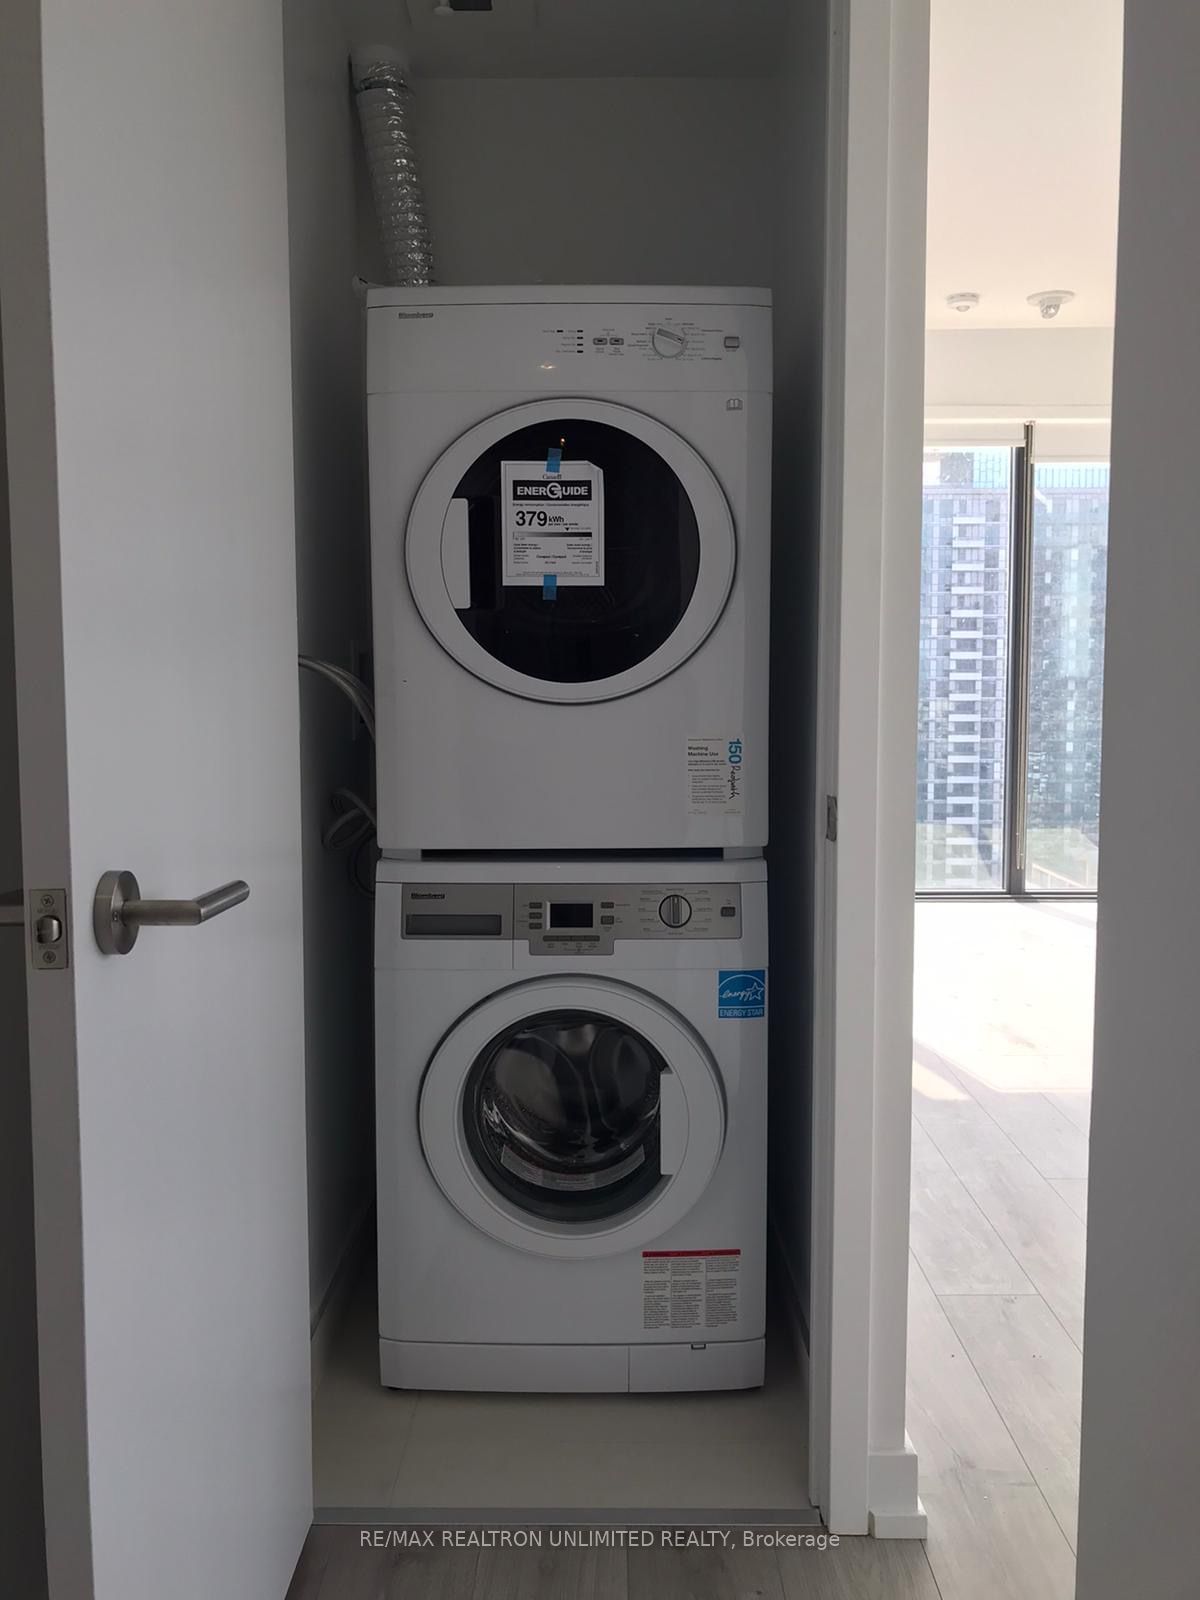
Stunning Bright Condo with Parking! Enjoy breathtaking unobstructed North/West views from this high-floor gem featuring custom roller blinds and an expansive 681 sq. ft. interior + 82 sq. ft. balcony. The open-concept layout boasts floor-to-ceiling windows, a modern split-bedroom design, and European-inspired finishes. Highlights include quartz countertops, ensuite laundry, and a chic, contemporary vibe. Located in the highly sought-after Yonge & Eglinton neighborhood, you're just minutes from the subway, shopping, top restaurants, and local eateries. Perfect for urban living with convenience and style!
ExtrasNew Painted Unit
re/max realtron unlimited realtyMLS® #C11886011
Amenities
Explore Neighbourhood
Similar Listings
Demographics
Based on the dissemination area as defined by Statistics Canada. A dissemination area contains, on average, approximately 200 – 400 households.
Price Trends
Maintenance Fees
Building Trends At 150 Redpath Condos
Days on Strata
List vs Selling Price
Or in other words, the
Offer Competition
Turnover of Units
Property Value
Price Ranking
Sold Units
Rented Units
Best Value Rank
Appreciation Rank
Rental Yield
High Demand
Transaction Insights at 161 Roehampton Avenue
| Studio | 1 Bed | 1 Bed + Den | 2 Bed | 2 Bed + Den | 3 Bed + Den | |
|---|---|---|---|---|---|---|
| Price Range | No Data | $492,000 - $510,000 | $545,000 - $685,000 | $687,950 - $782,888 | $1,063,899 - $1,280,000 | $1,700,000 |
| Avg. Cost Per Sqft | No Data | $1,025 | $1,004 | $1,088 | $1,003 | $815 |
| Price Range | $2,000 - $2,080 | $1,950 - $2,500 | $2,250 - $3,000 | $2,750 - $3,400 | $3,400 - $4,750 | No Data |
| Avg. Wait for Unit Availability | 80 Days | 60 Days | 20 Days | 63 Days | 193 Days | No Data |
| Avg. Wait for Unit Availability | 54 Days | 12 Days | 6 Days | 15 Days | 129 Days | 1240 Days |
| Ratio of Units in Building | 5% | 23% | 51% | 20% | 4% | 1% |
Transactions vs Inventory
Total number of units listed and leased in Mount Pleasant West
