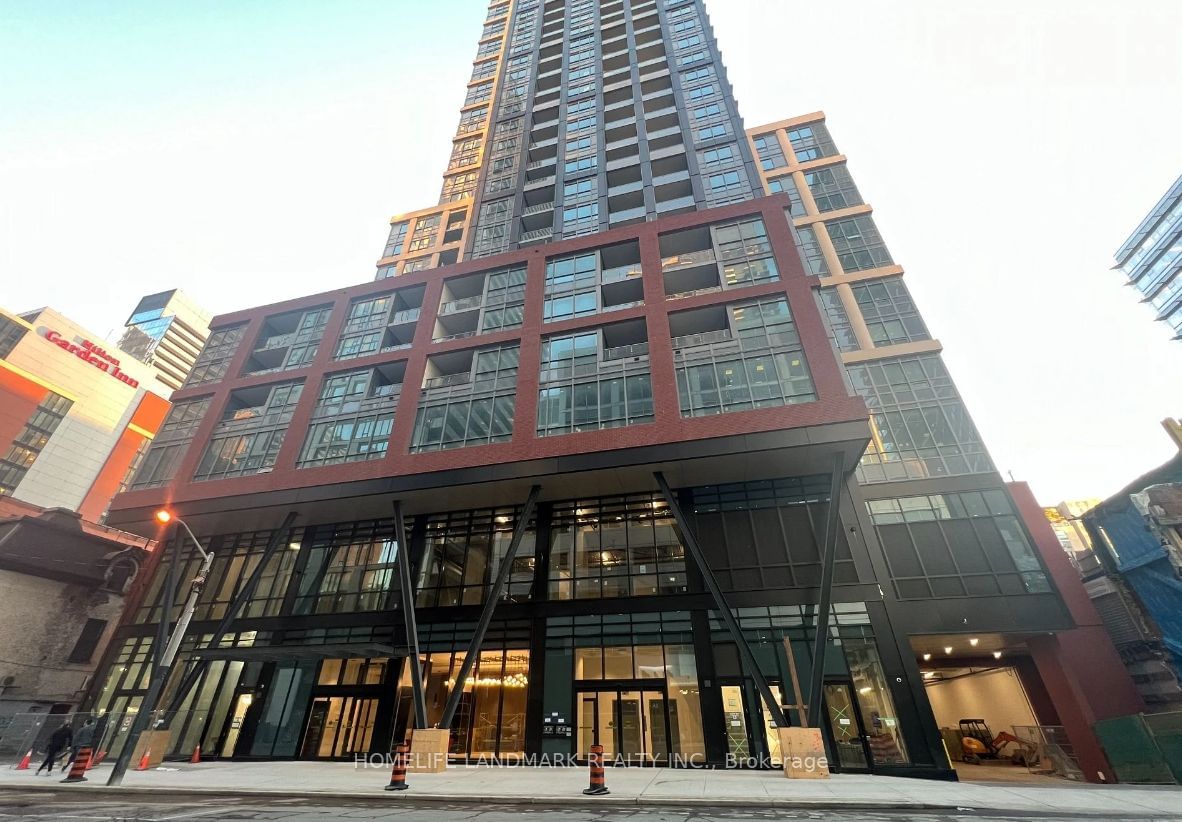
4609 - 108 Peter St
Listing History
Unit Highlights
Utilities Included
Utility Type
- Air Conditioning
- Central Air
- Heat Source
- Gas
- Heating
- Forced Air
Room Dimensions
Room dimensions are not available for this listing.
About this Listing
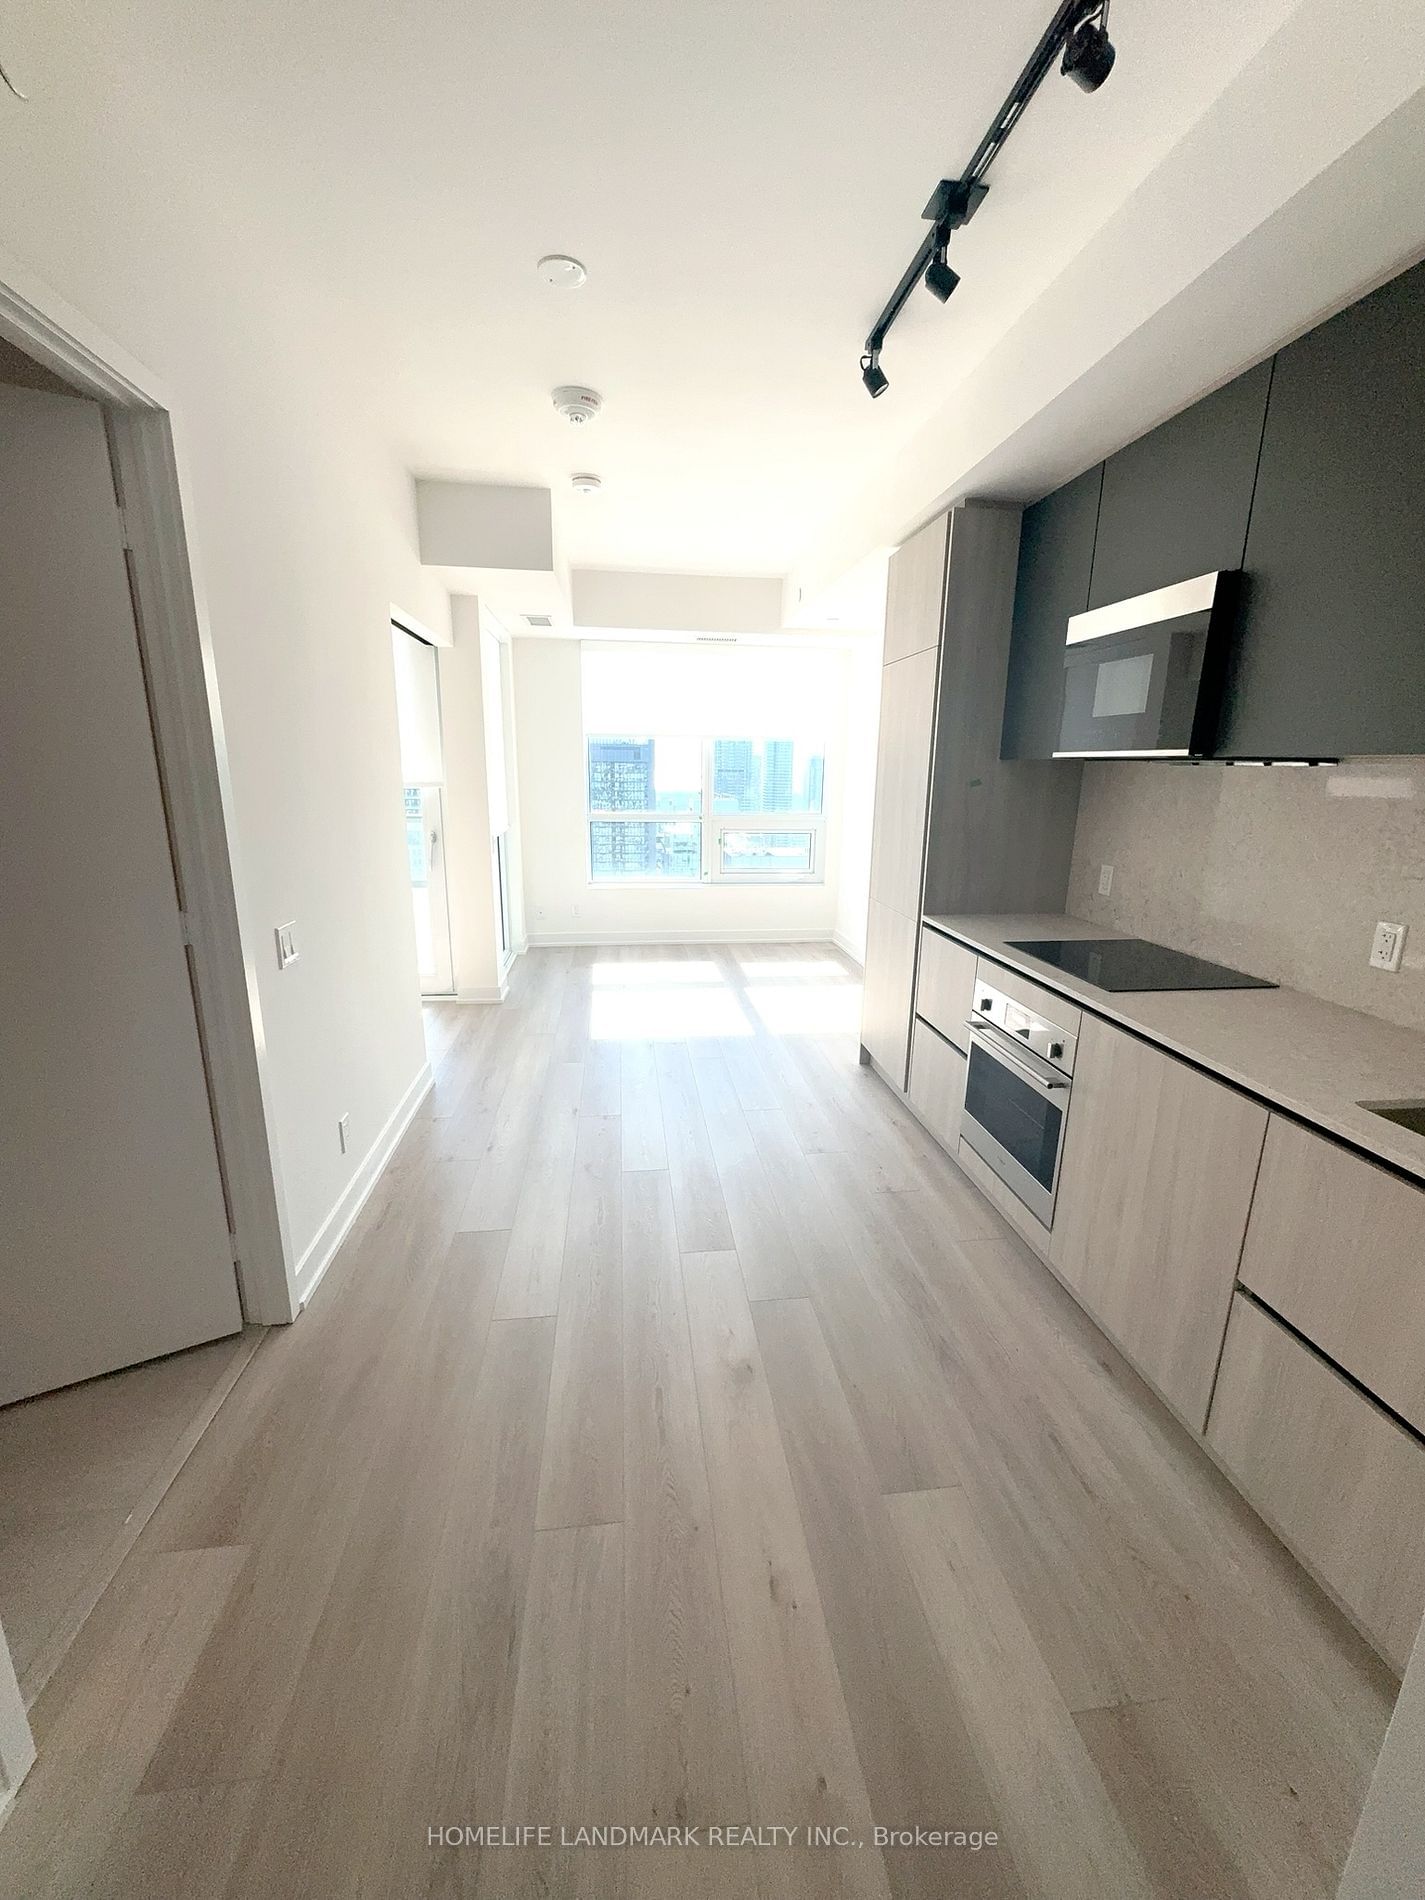
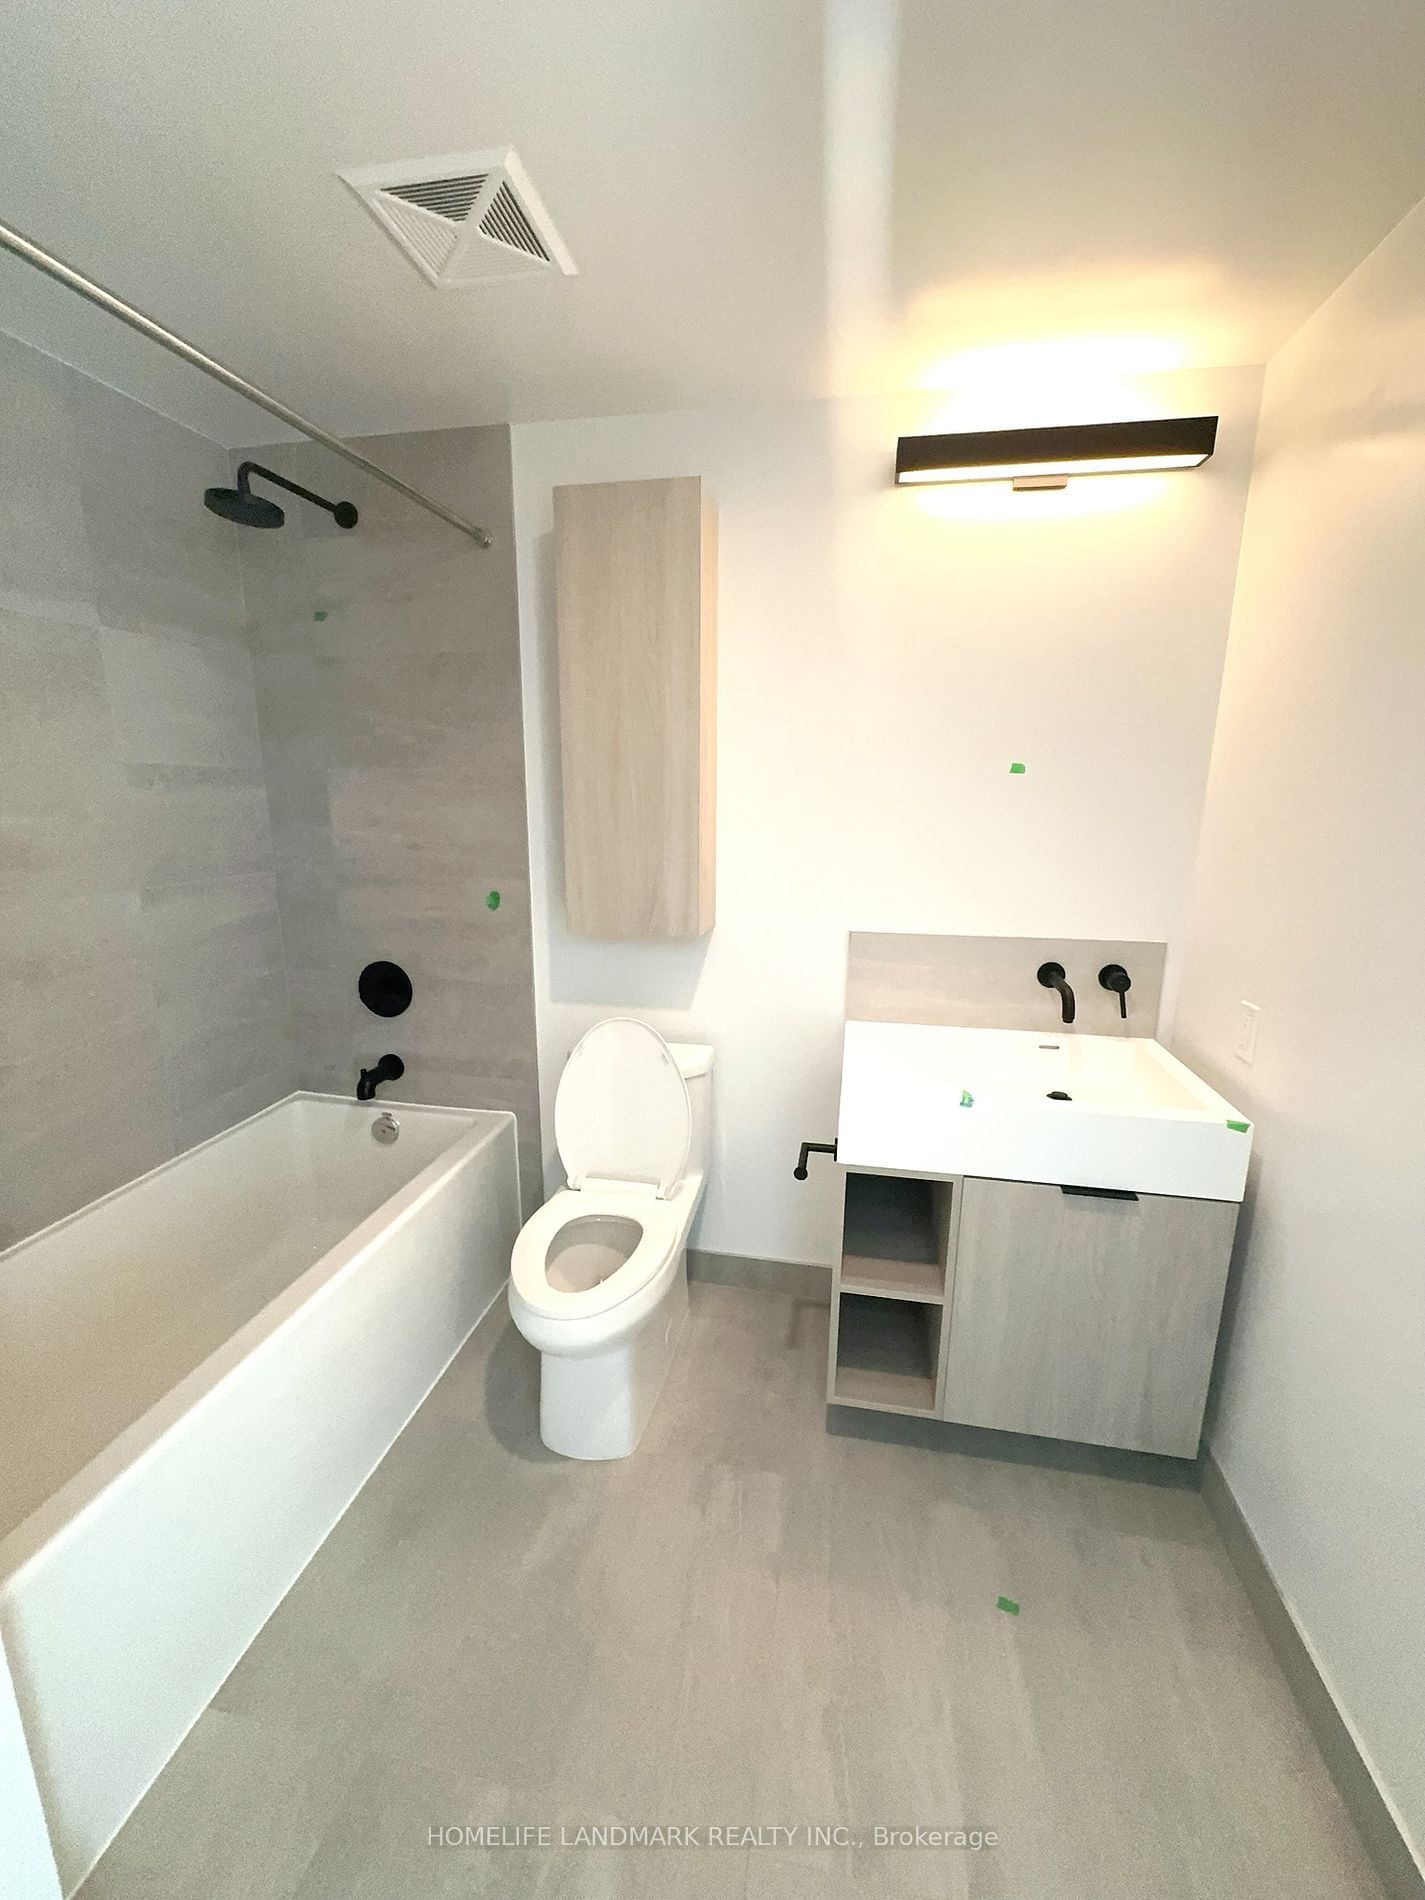
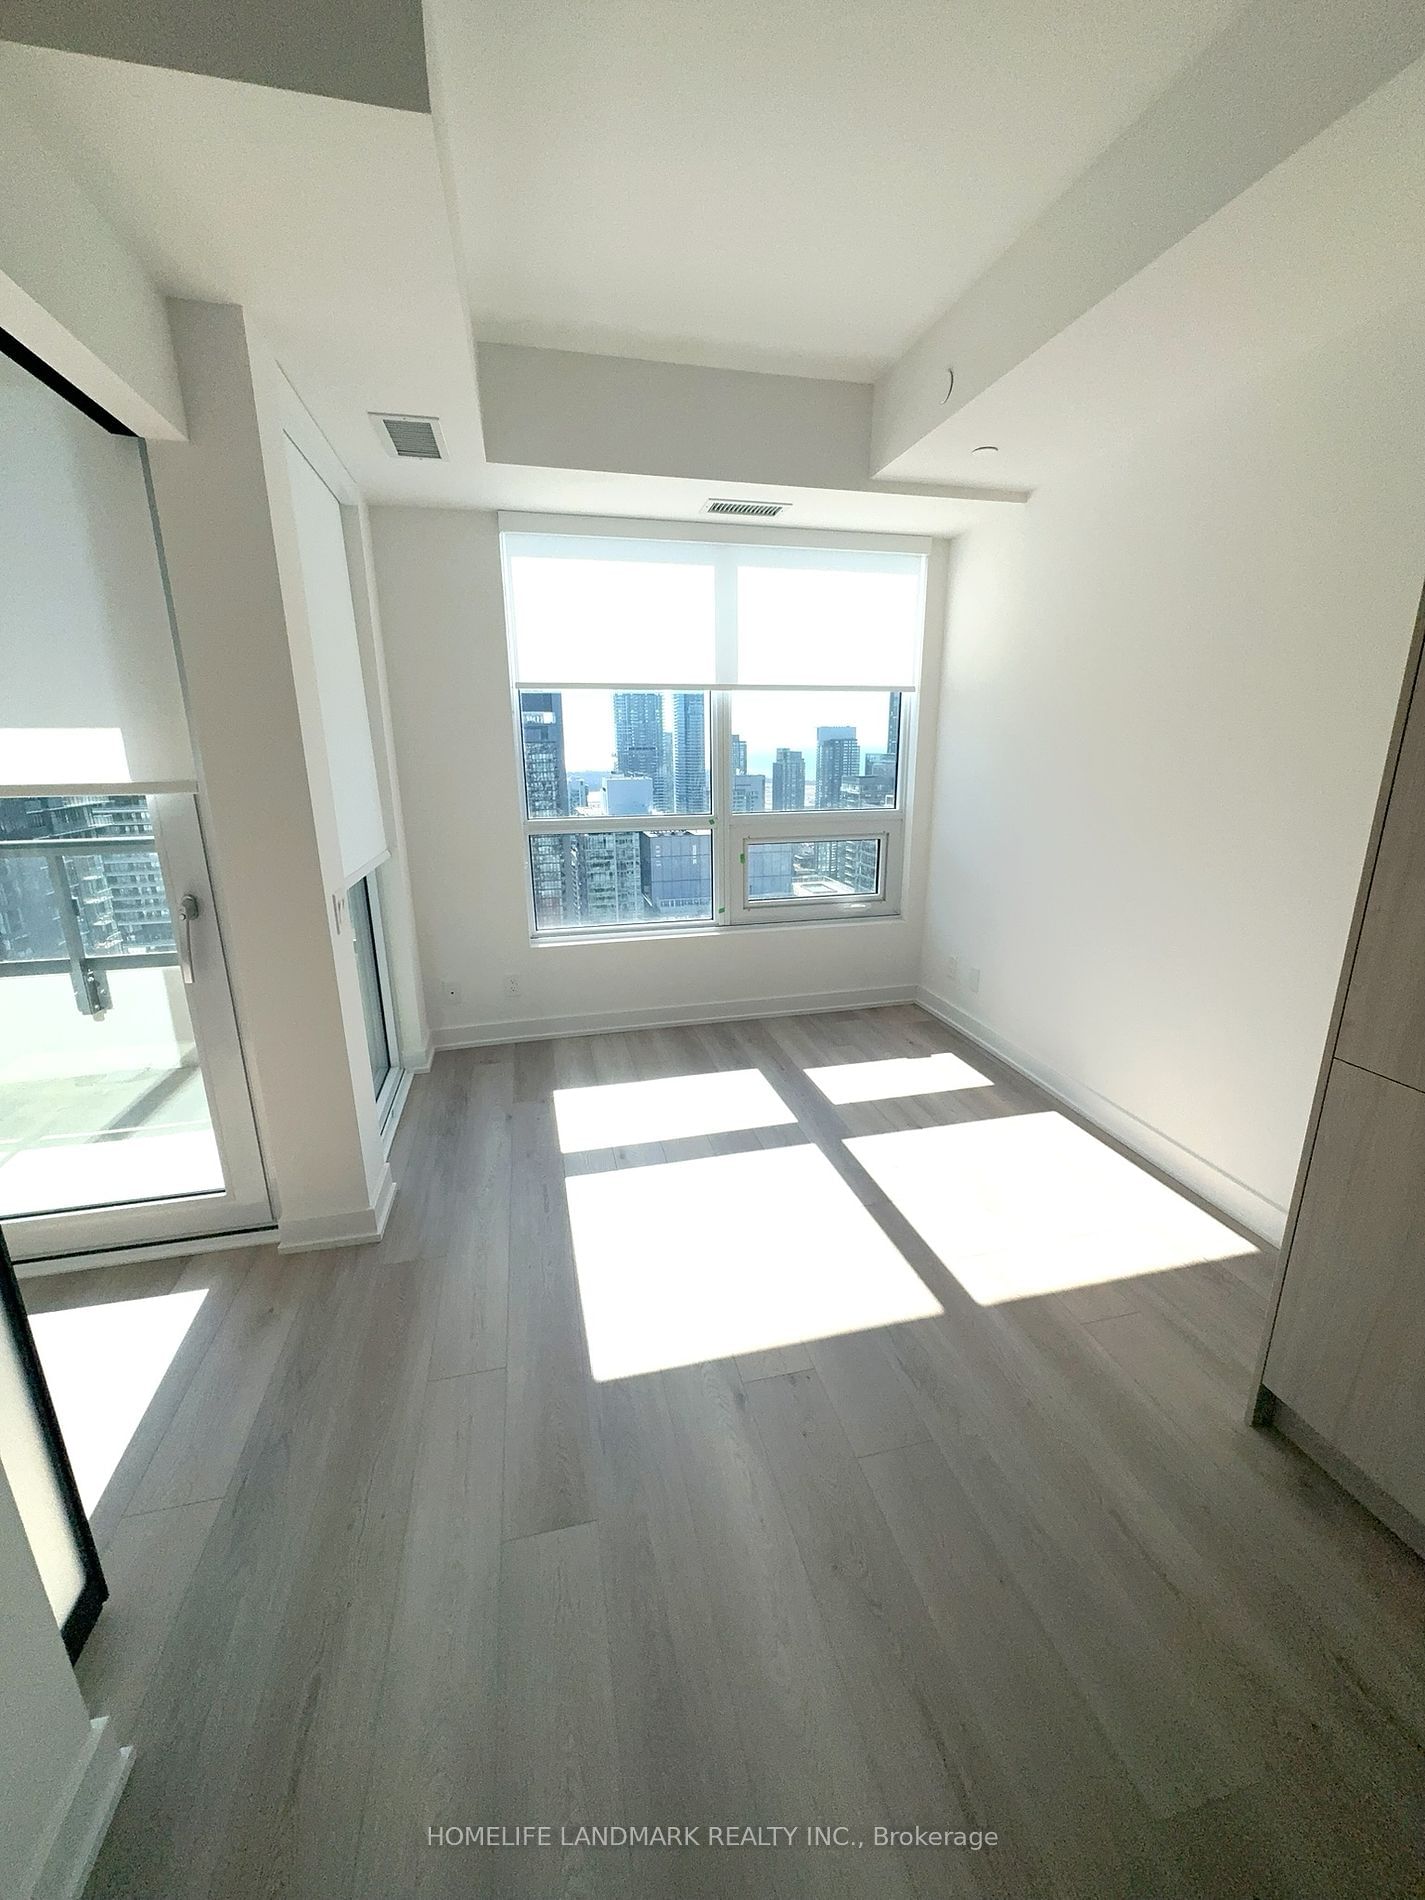
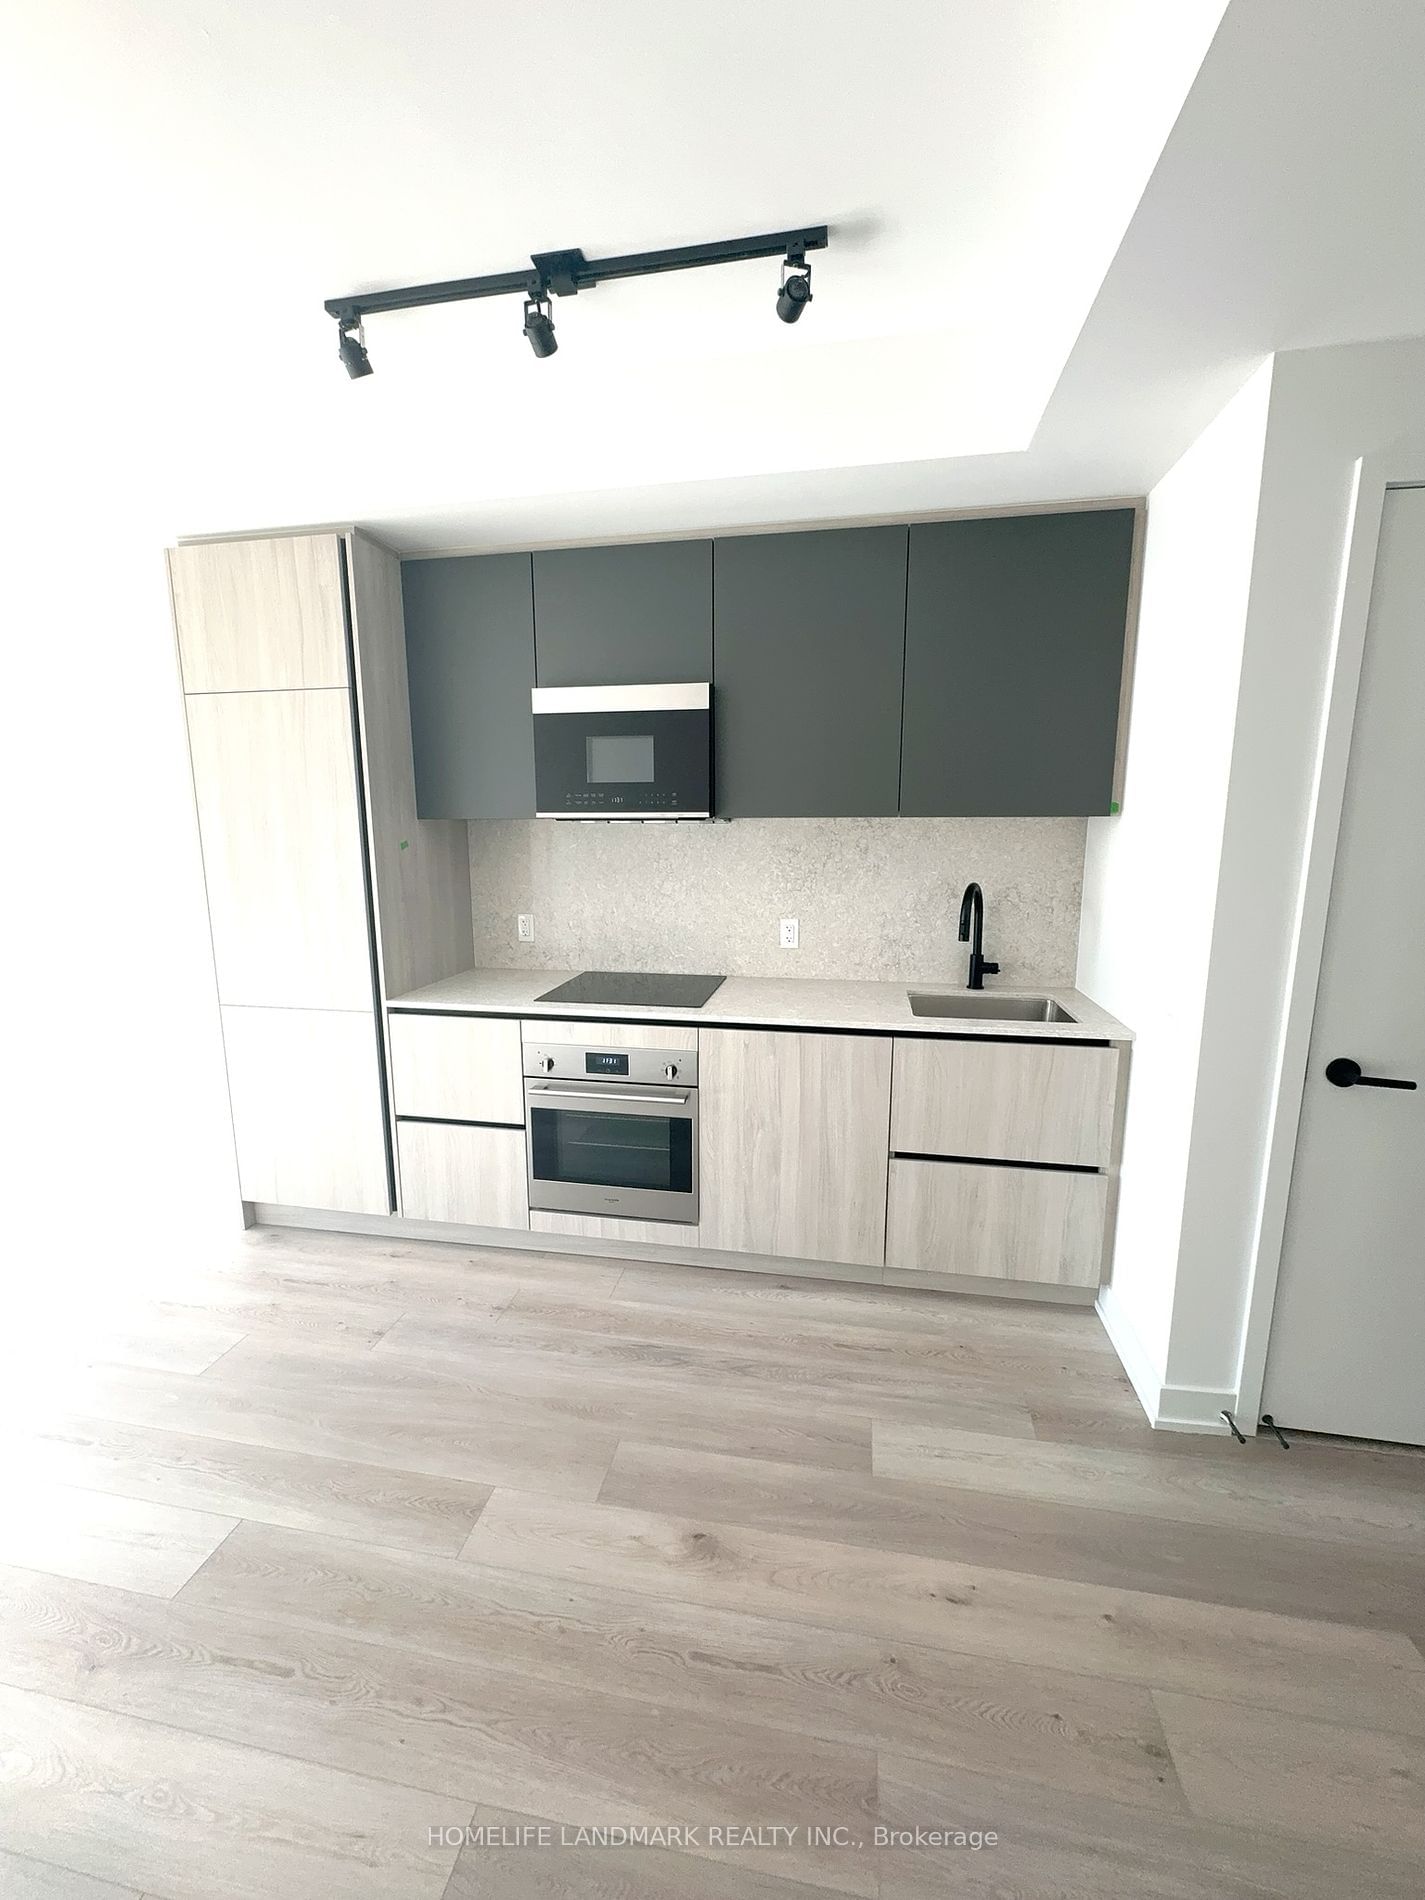
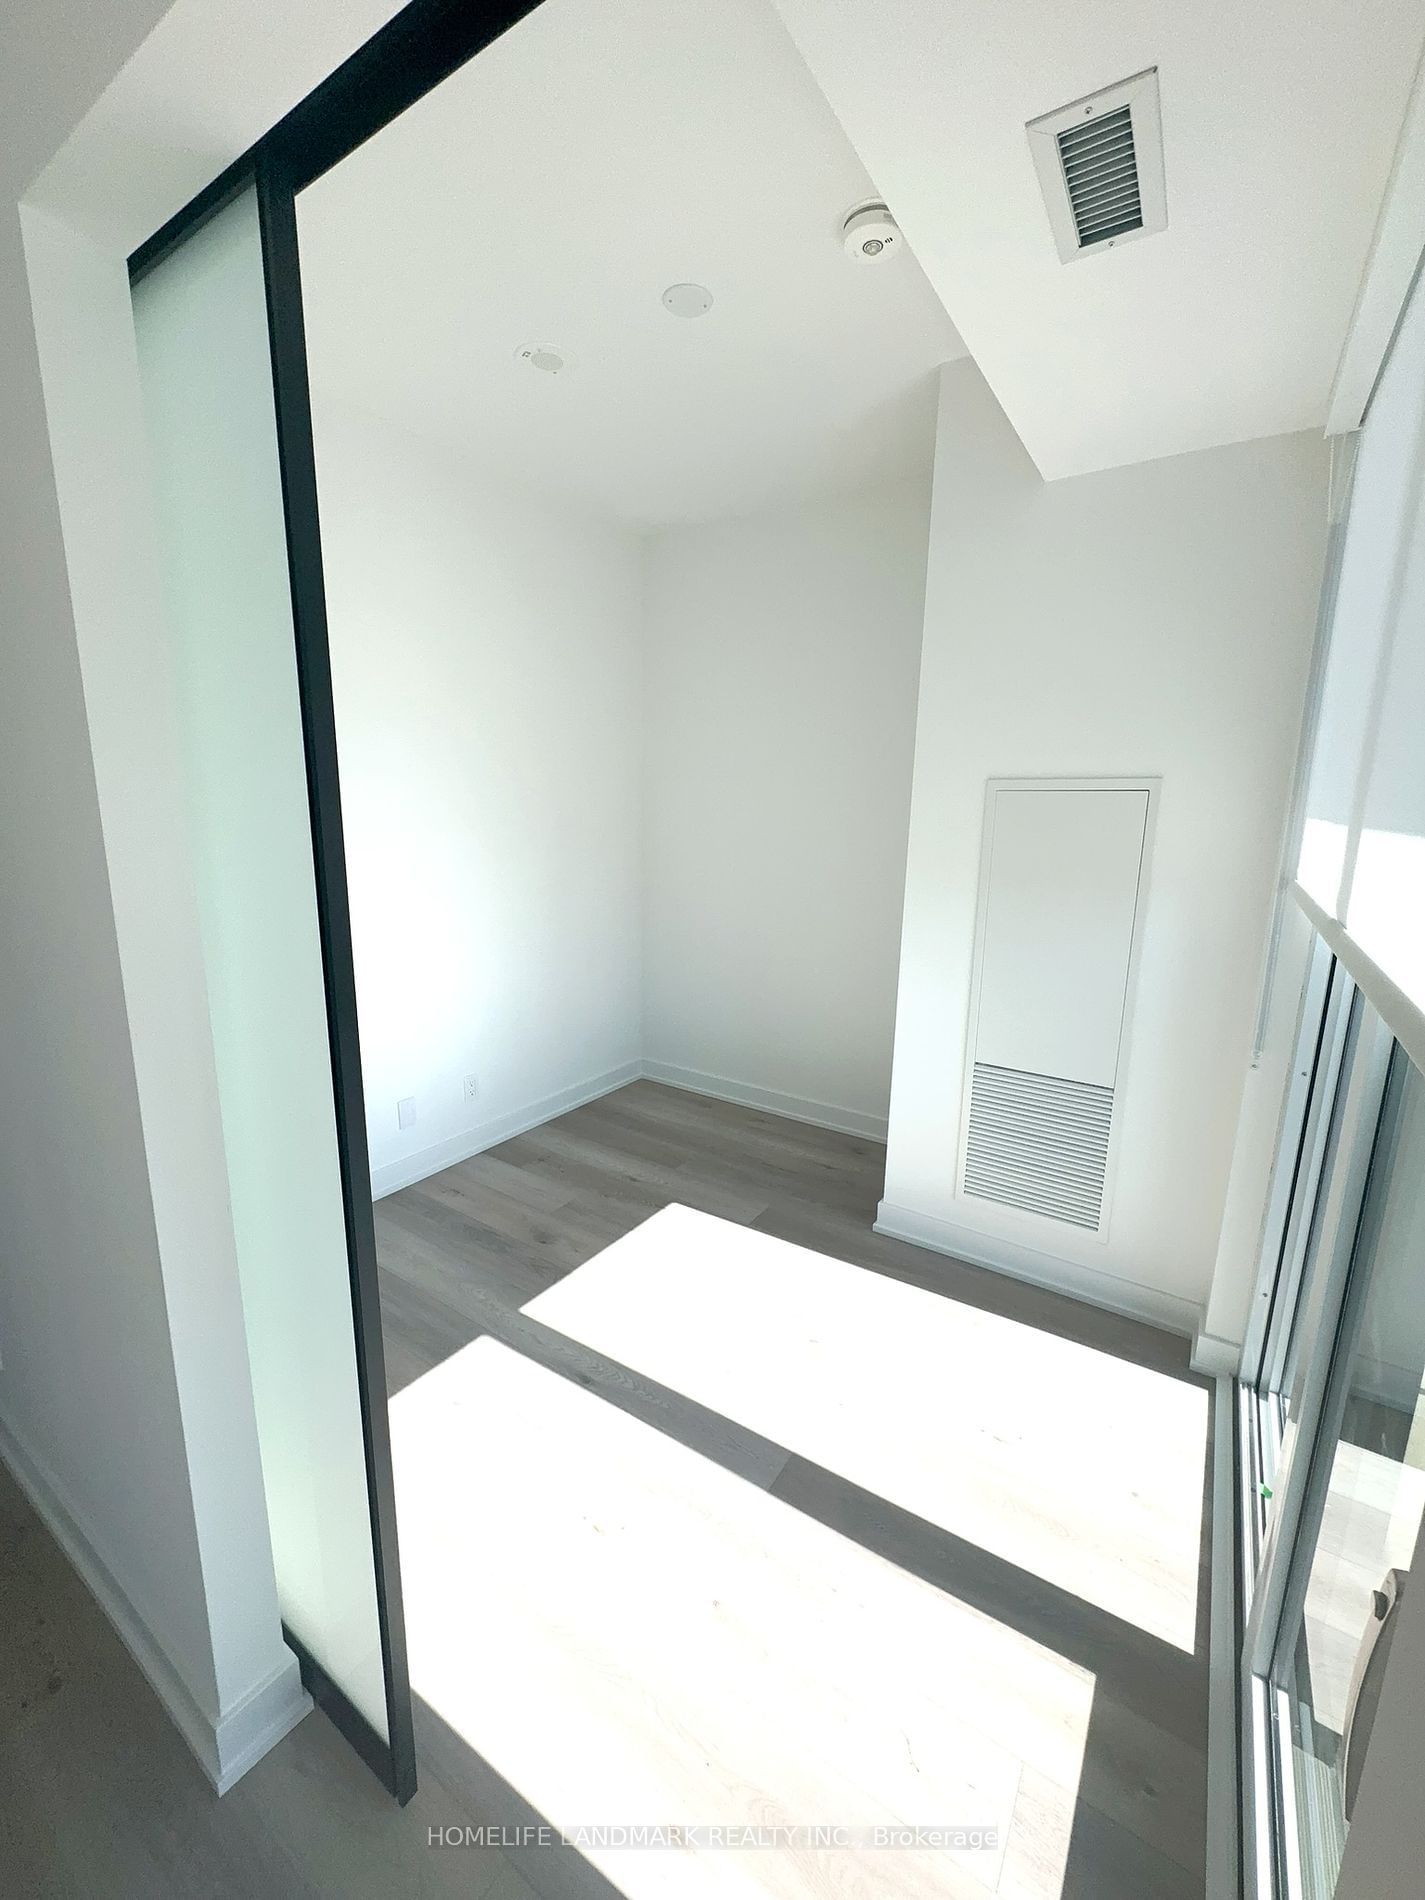
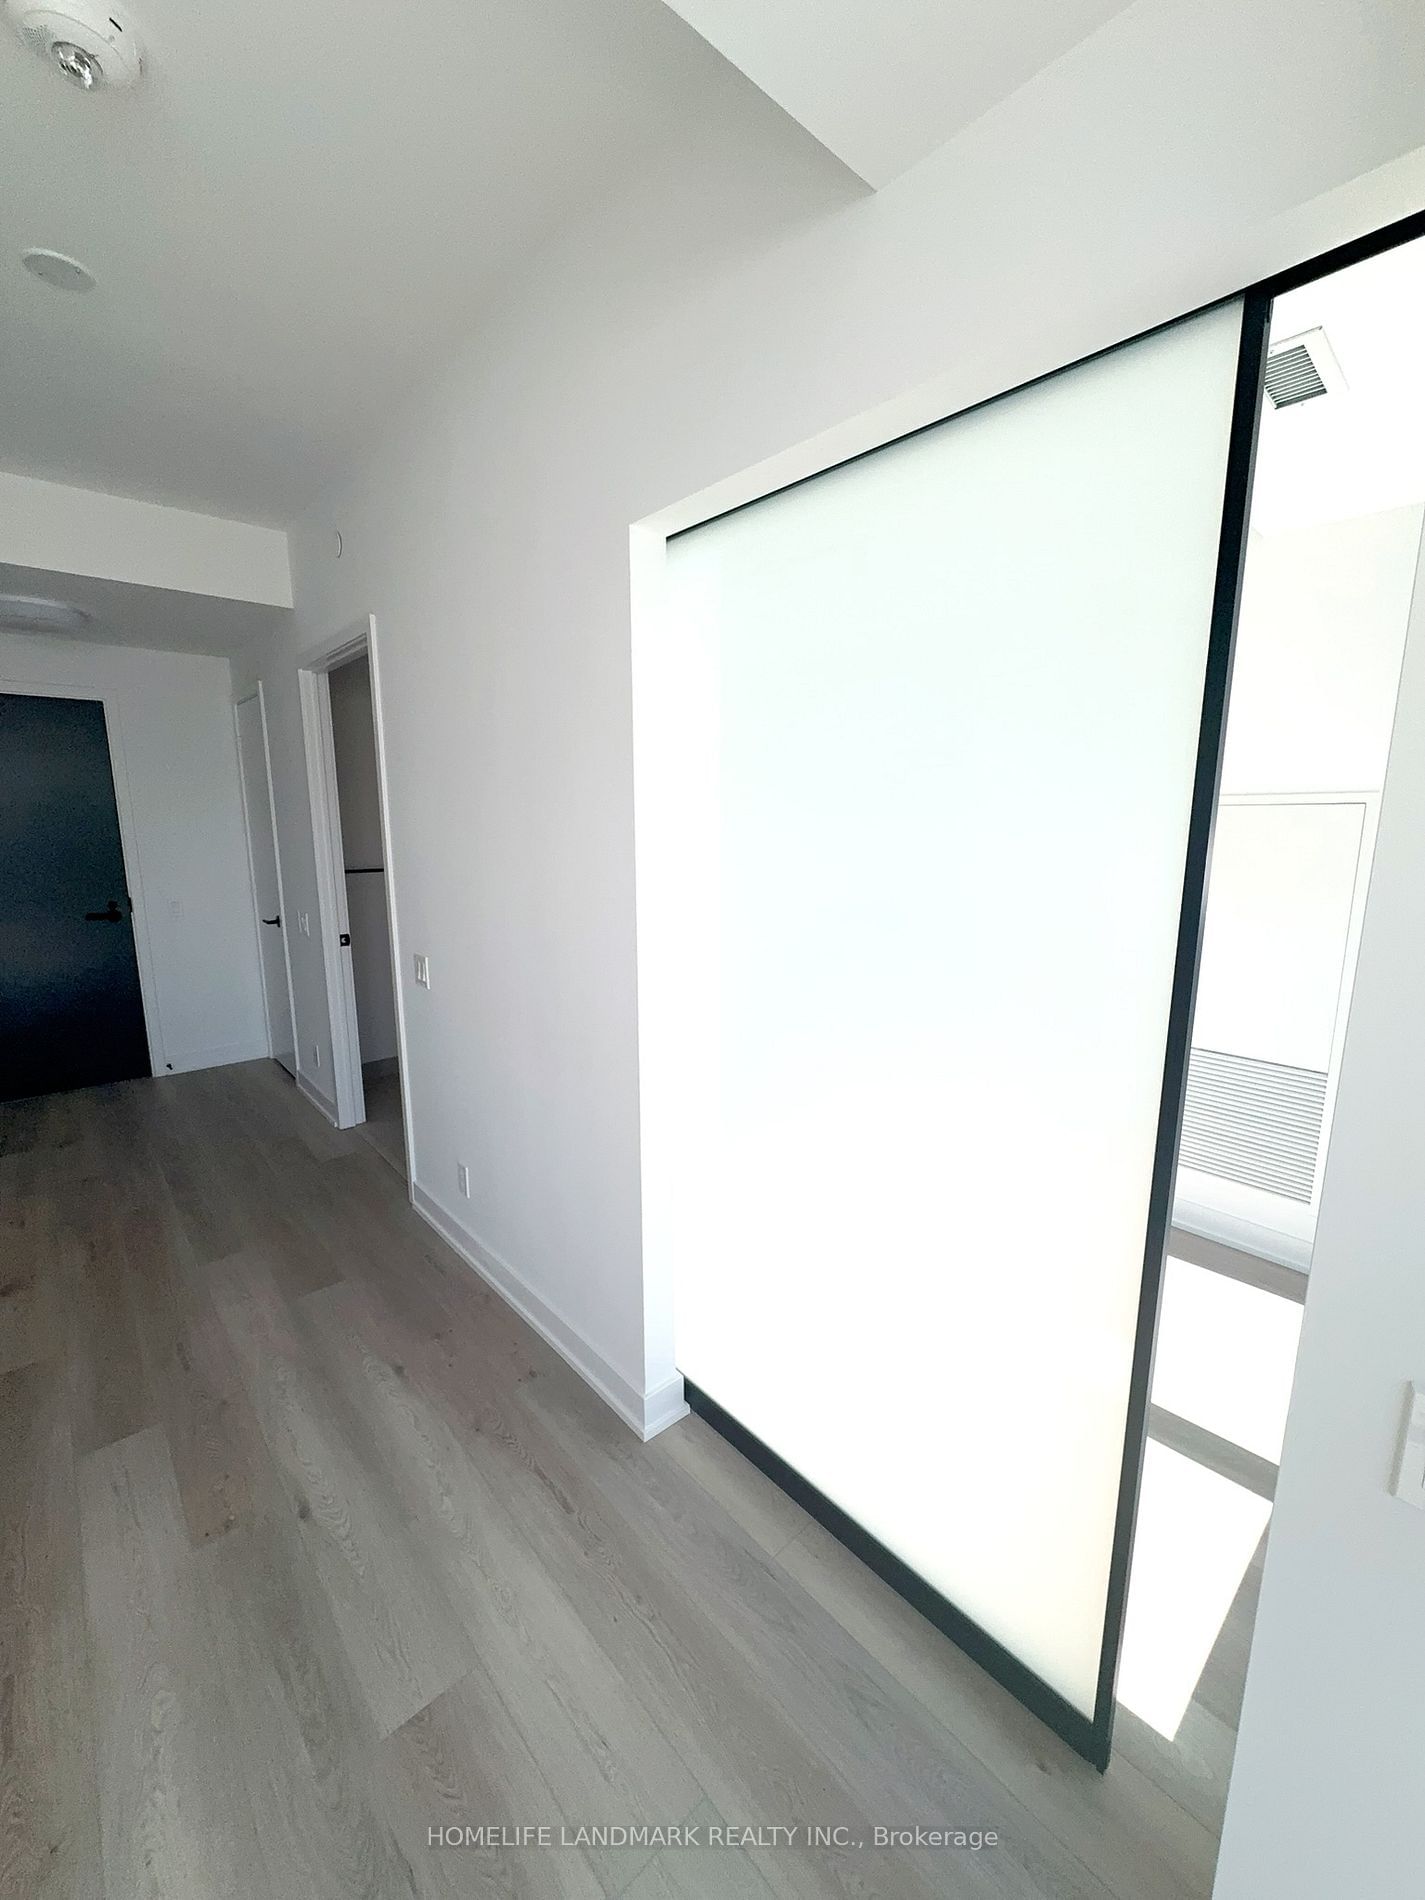
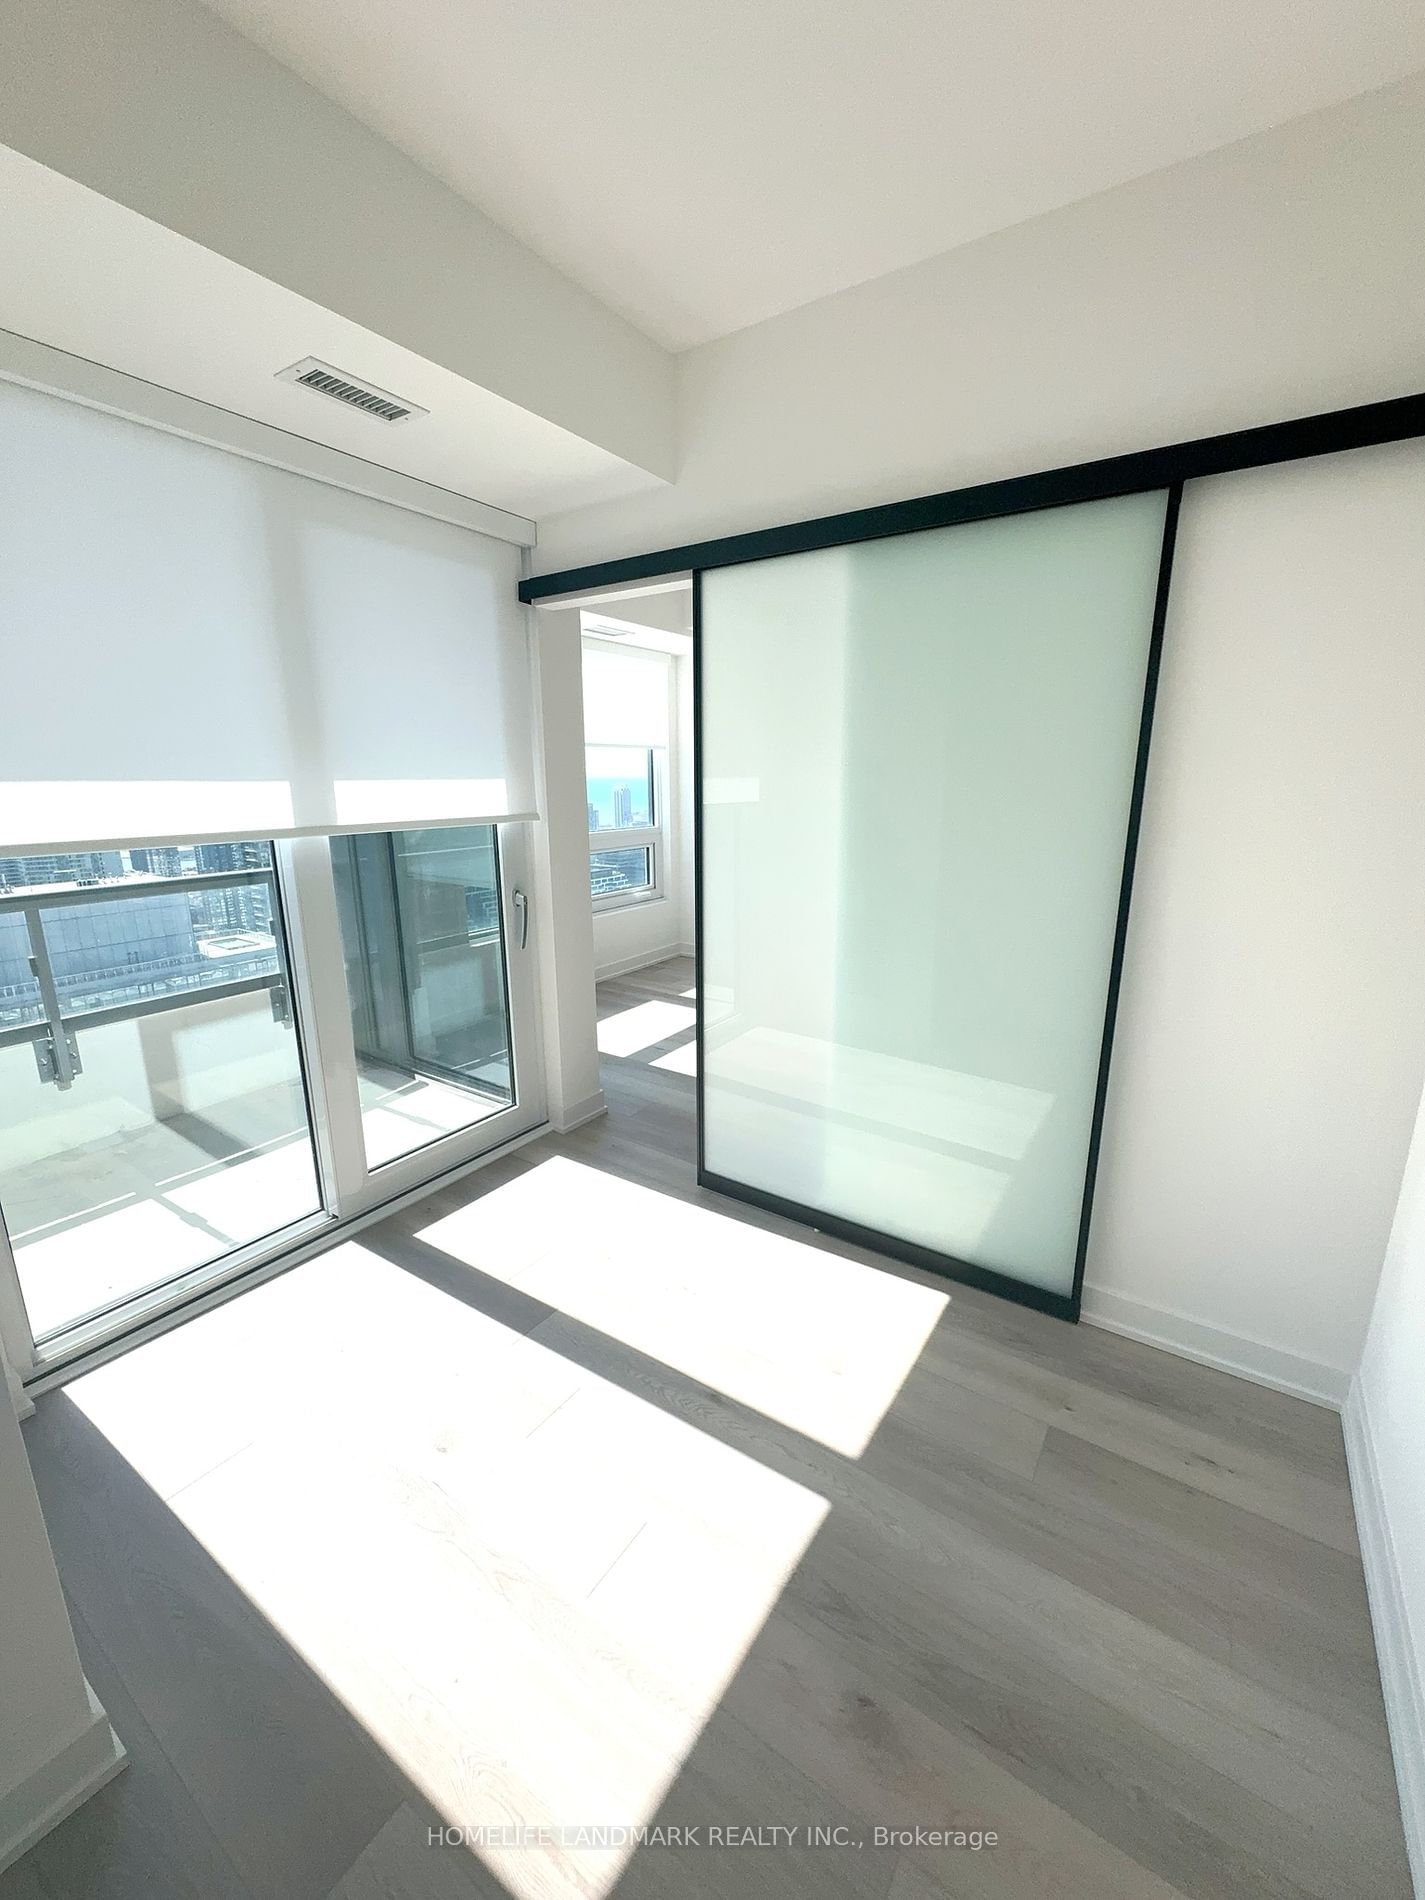
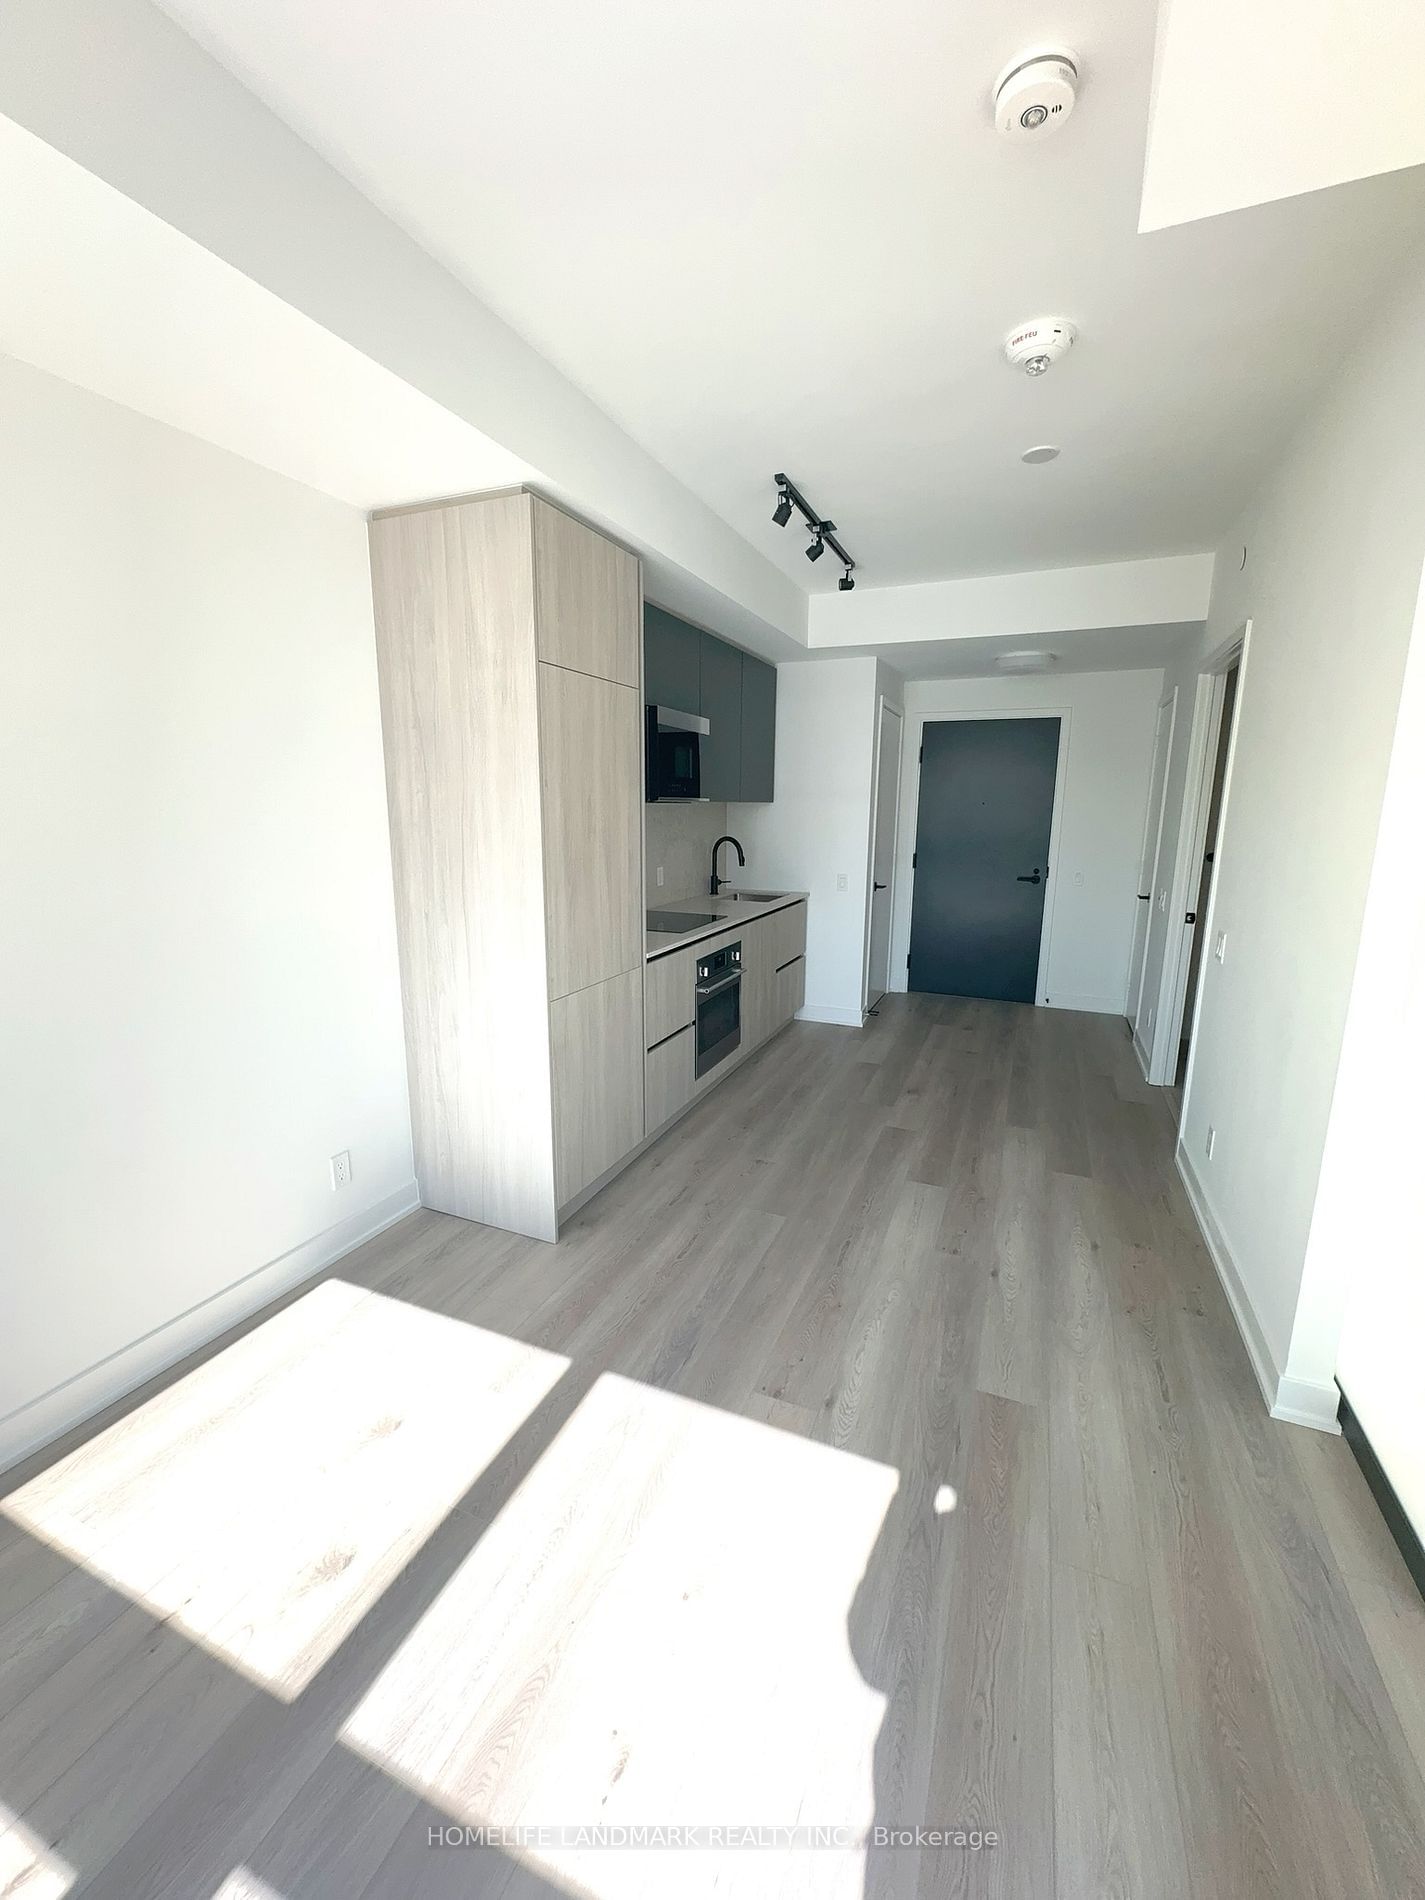
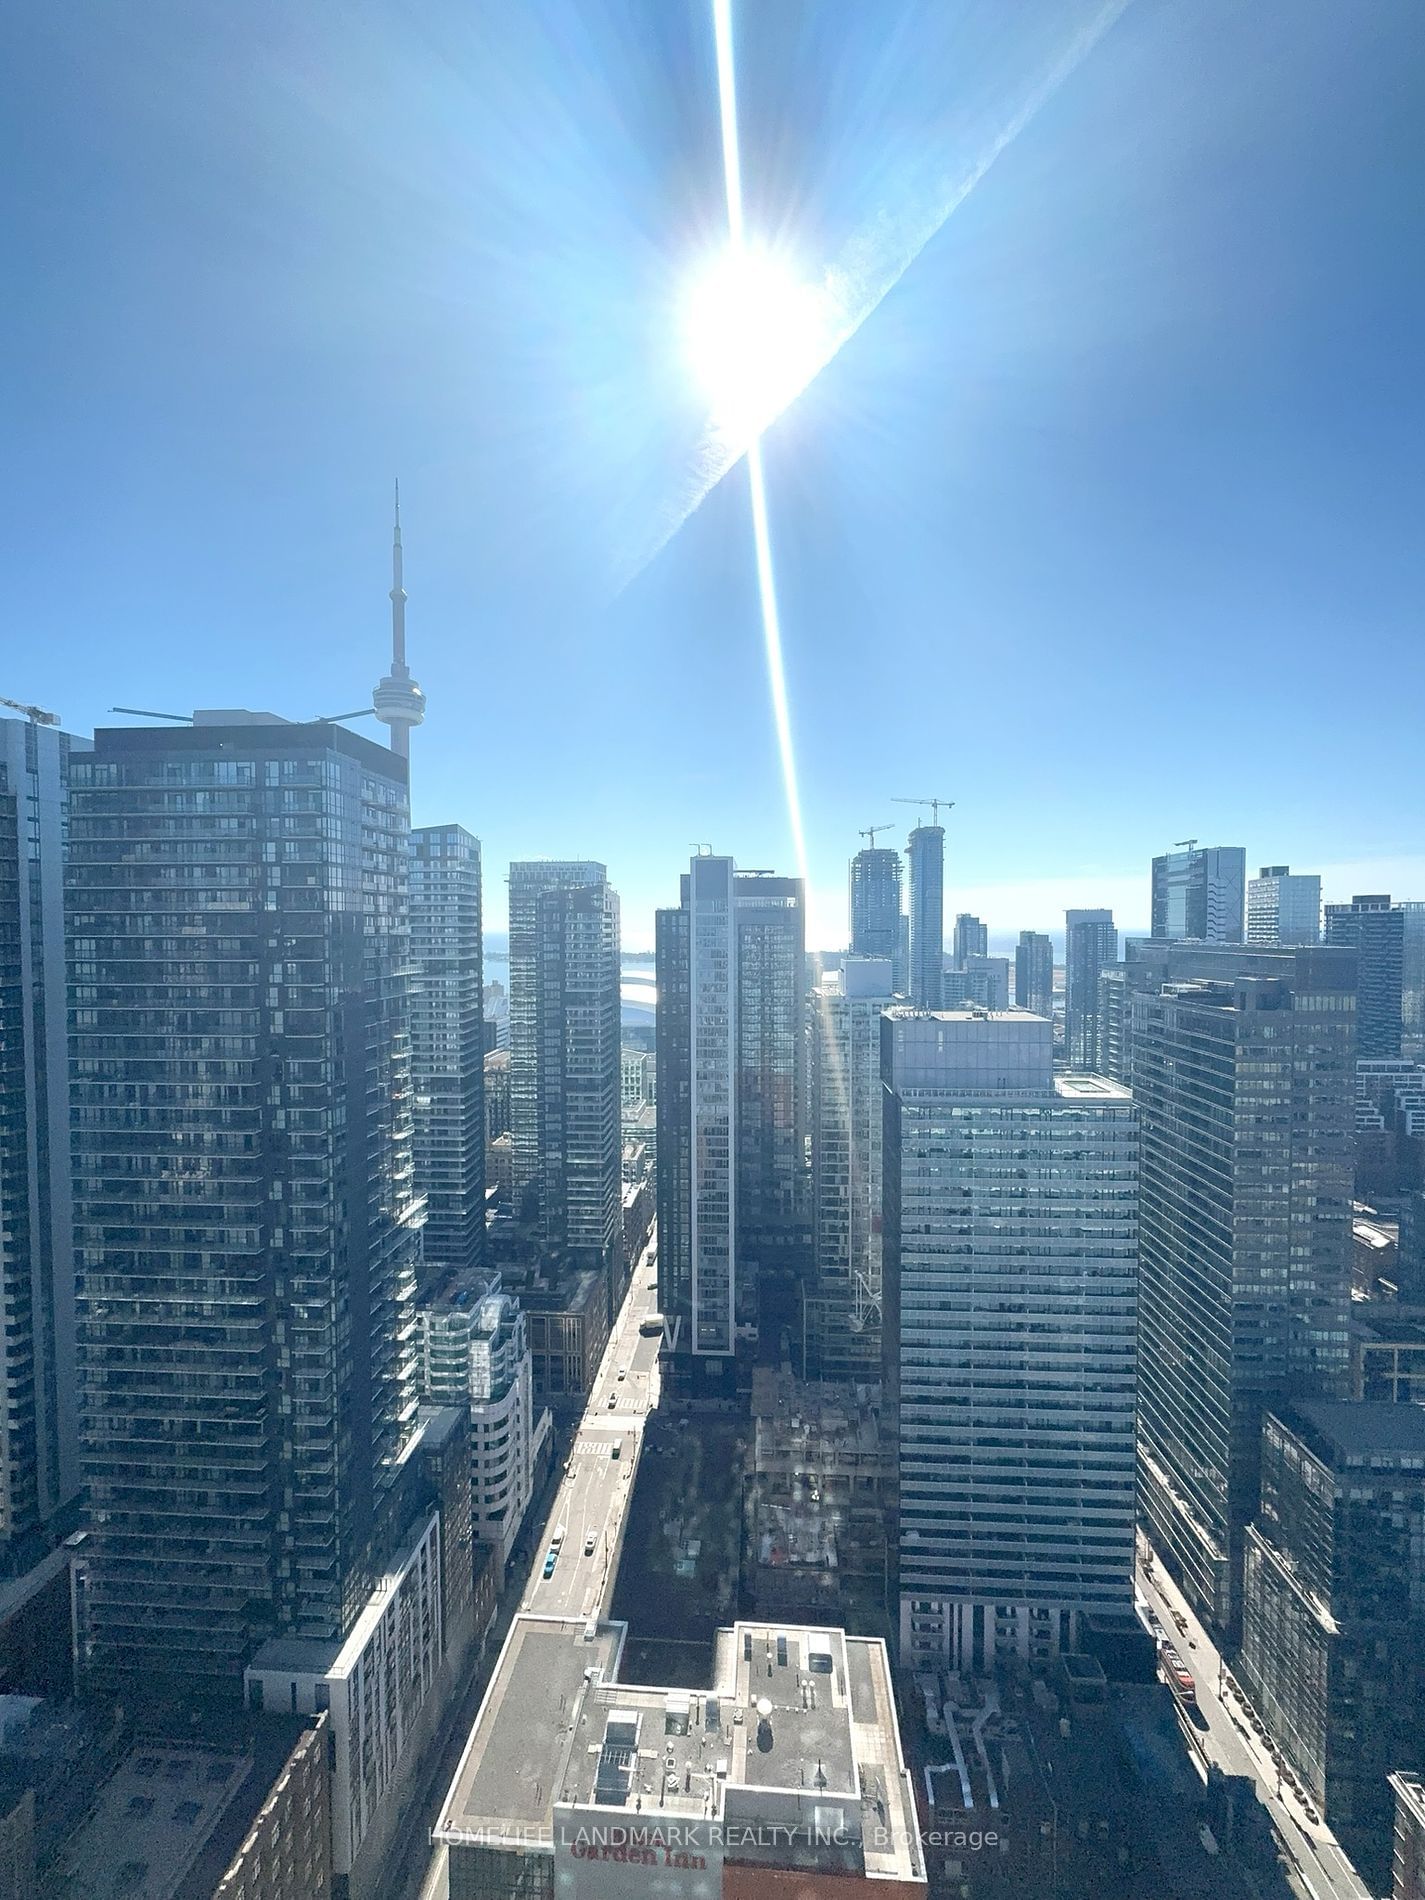
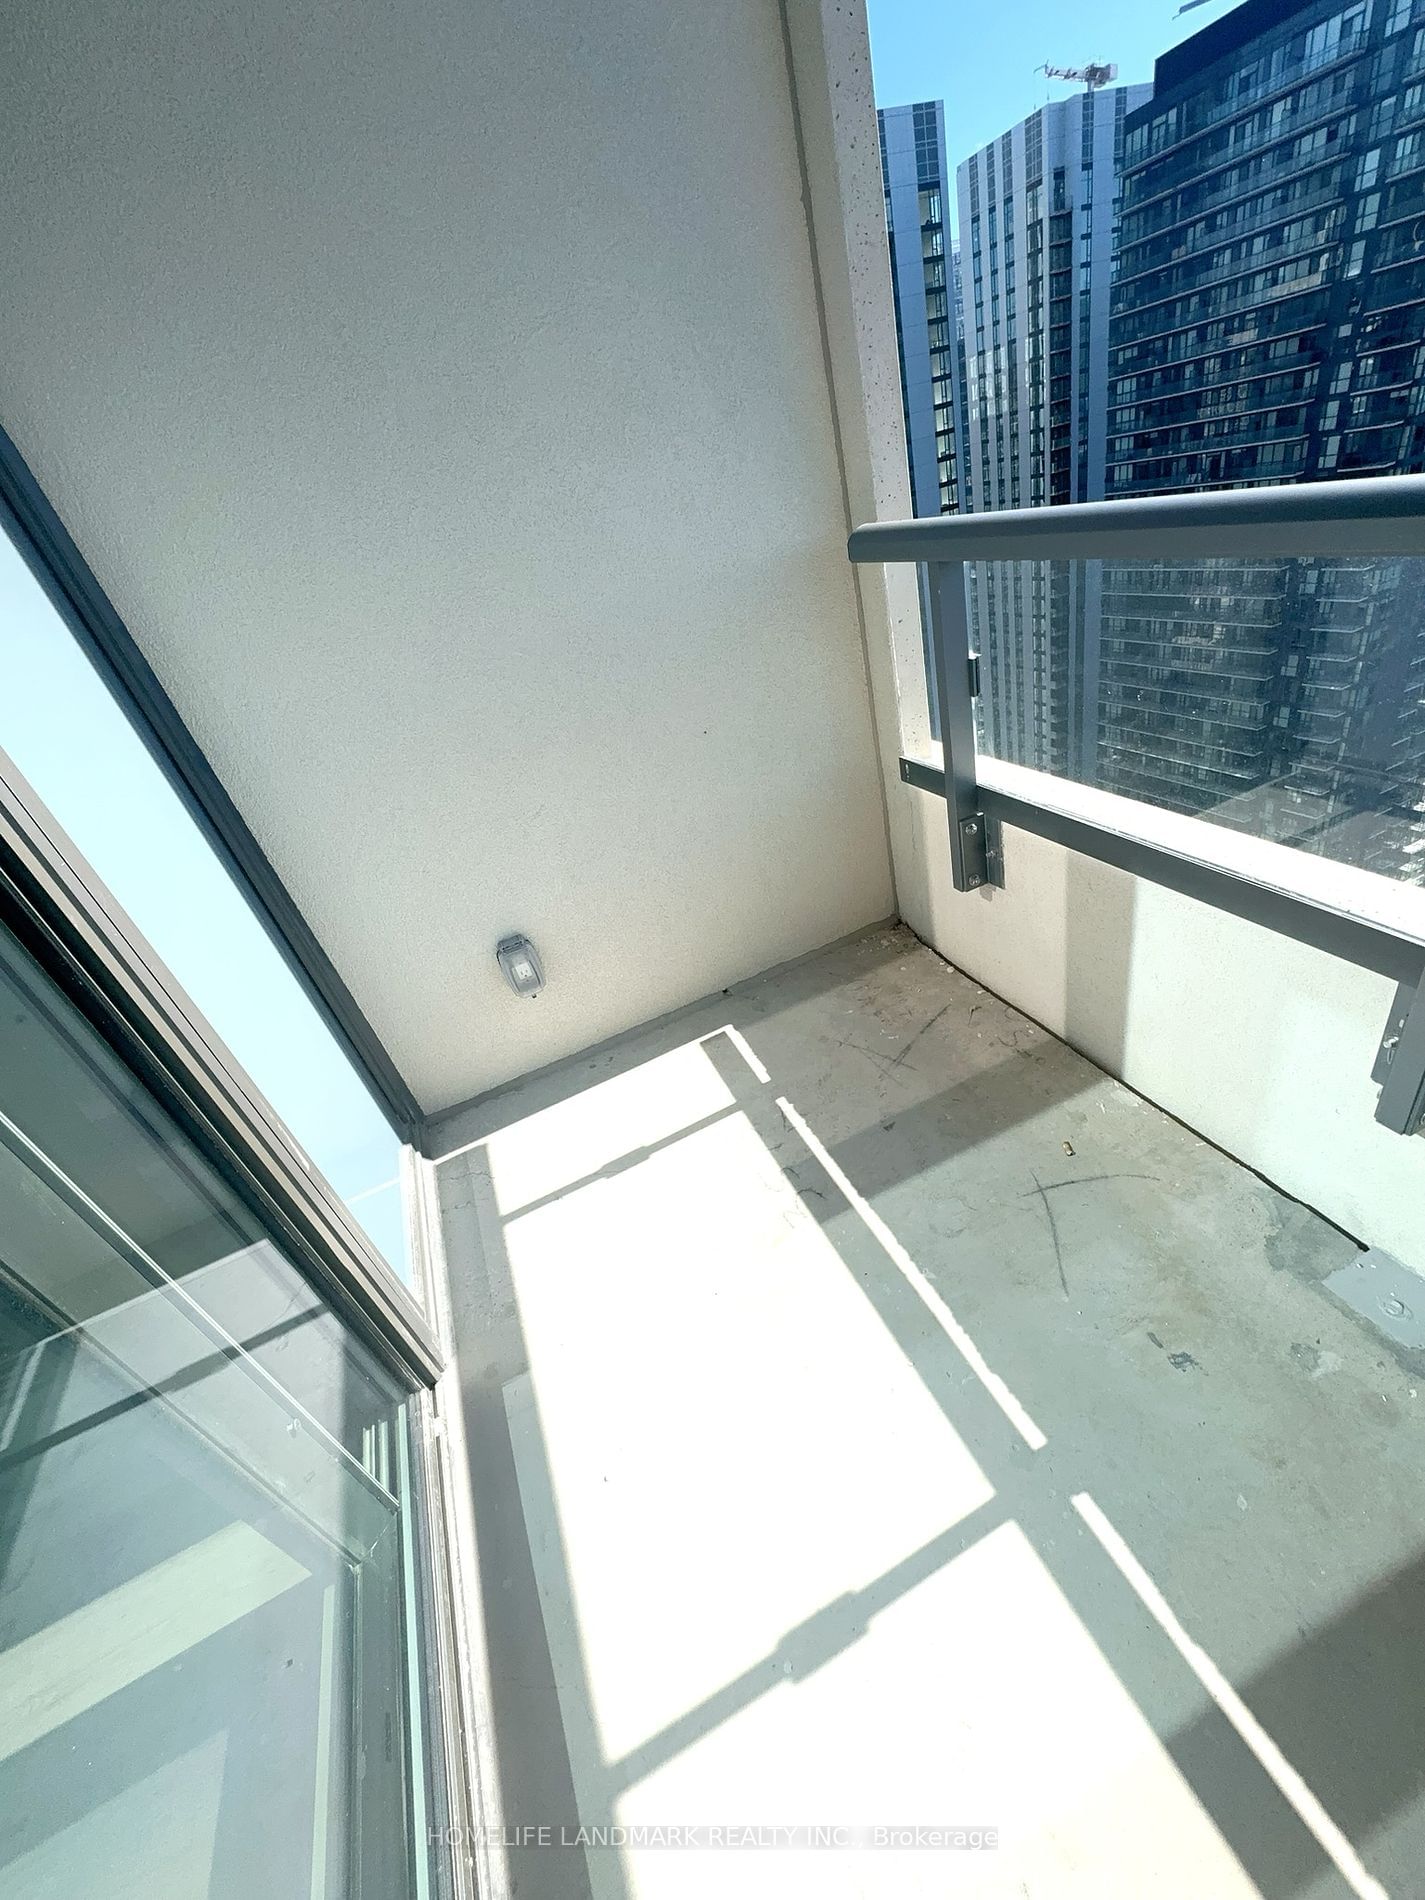
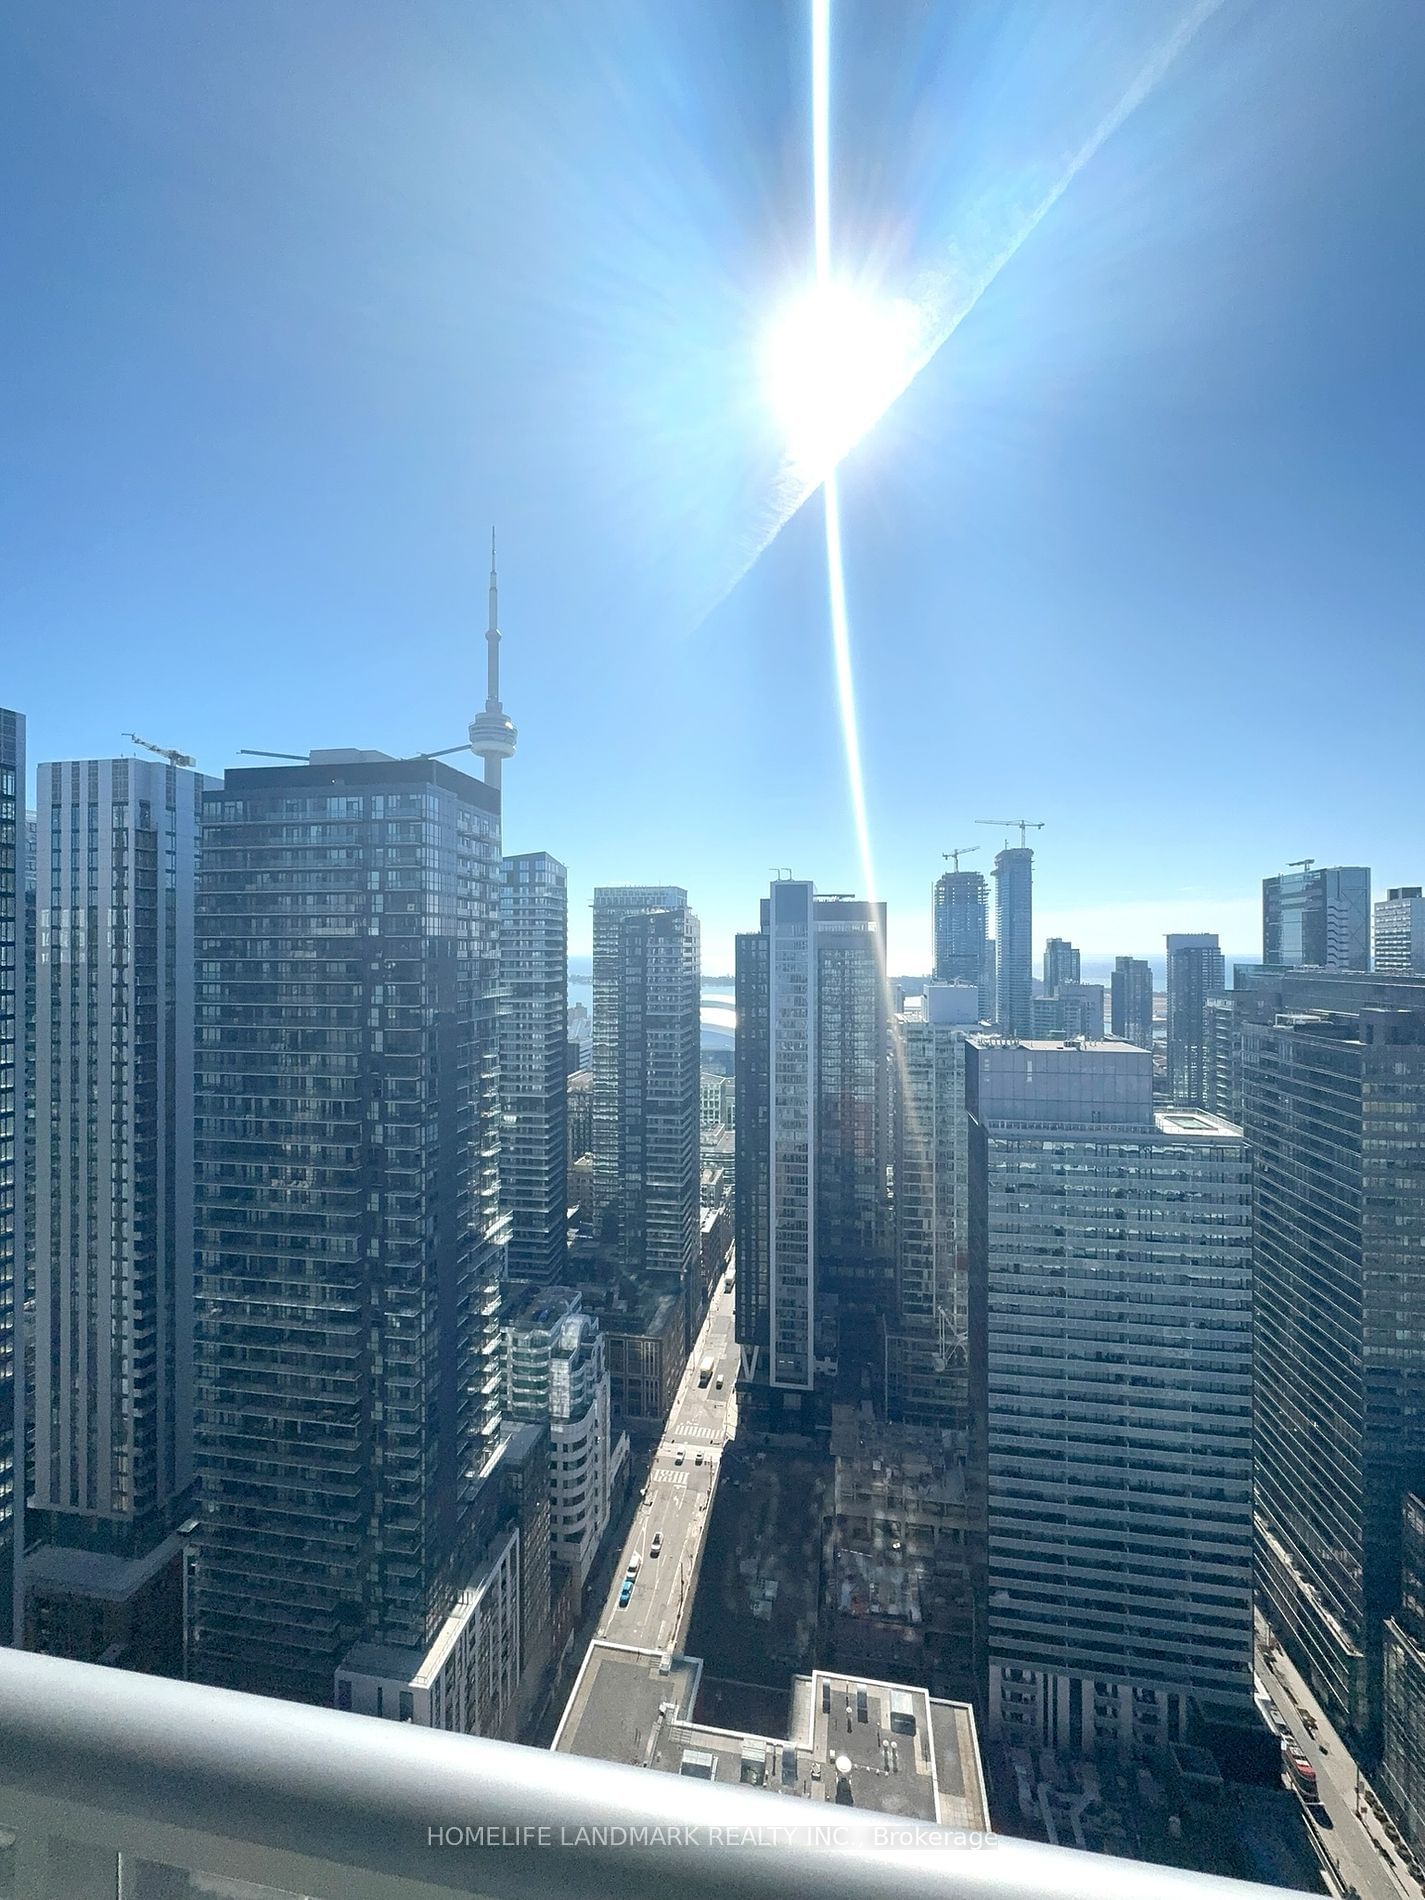
Situated on one of the top 46 high floors, new, one-bedroom unit in Toronto's bustling Entertainment District boasts south-facing views that beautifully capture the city skyline and Lake Ontario. With unrivaled walk and transit scores of 100, residents have immediate access to subways, streetcars, parks, groceries, and the finest dining and entertainment options. This unit features a meticulously designed floorplan and luxurious, trendy finishes, including a modern kitchen with sleek built-in appliances. Amenities enhance the living experience with an infra-red sauna and an outdoor children's play area, making it the epitome of comfort, convenience, and high-rise sophistication in the heart of the city.
ExtrasB/I Fridge, B/I Stove, Dishwasher, Washer And Dryer, Hood Fan, Cook Top
homelife landmark realty inc.MLS® #C11903702
Amenities
Explore Neighbourhood
Similar Listings
Demographics
Based on the dissemination area as defined by Statistics Canada. A dissemination area contains, on average, approximately 200 – 400 households.
Price Trends
Maintenance Fees
Building Trends At Peter & Adelaide Condos
Days on Strata
List vs Selling Price
Offer Competition
Turnover of Units
Property Value
Price Ranking
Sold Units
Rented Units
Best Value Rank
Appreciation Rank
Rental Yield
High Demand
Transaction Insights at 350 Adelaide Street W
| Studio | 1 Bed | 1 Bed + Den | 2 Bed | 2 Bed + Den | 3 Bed | 3 Bed + Den | |
|---|---|---|---|---|---|---|---|
| Price Range | No Data | $485,000 - $635,000 | $590,000 - $770,000 | $720,000 - $1,070,000 | $893,000 | $875,000 - $1,340,000 | No Data |
| Avg. Cost Per Sqft | No Data | $1,202 | $1,187 | $1,152 | $1,298 | $1,142 | No Data |
| Price Range | No Data | $1,350 - $2,700 | $2,250 - $3,200 | $1,380 - $3,500 | $2,950 - $3,700 | $2,800 - $5,450 | No Data |
| Avg. Wait for Unit Availability | No Data | 46 Days | 38 Days | 42 Days | No Data | 87 Days | No Data |
| Avg. Wait for Unit Availability | 22 Days | 5 Days | 3 Days | 4 Days | 11 Days | 11 Days | No Data |
| Ratio of Units in Building | 1% | 21% | 32% | 31% | 7% | 10% | 1% |
Transactions vs Inventory
Total number of units listed and leased in Queen West
