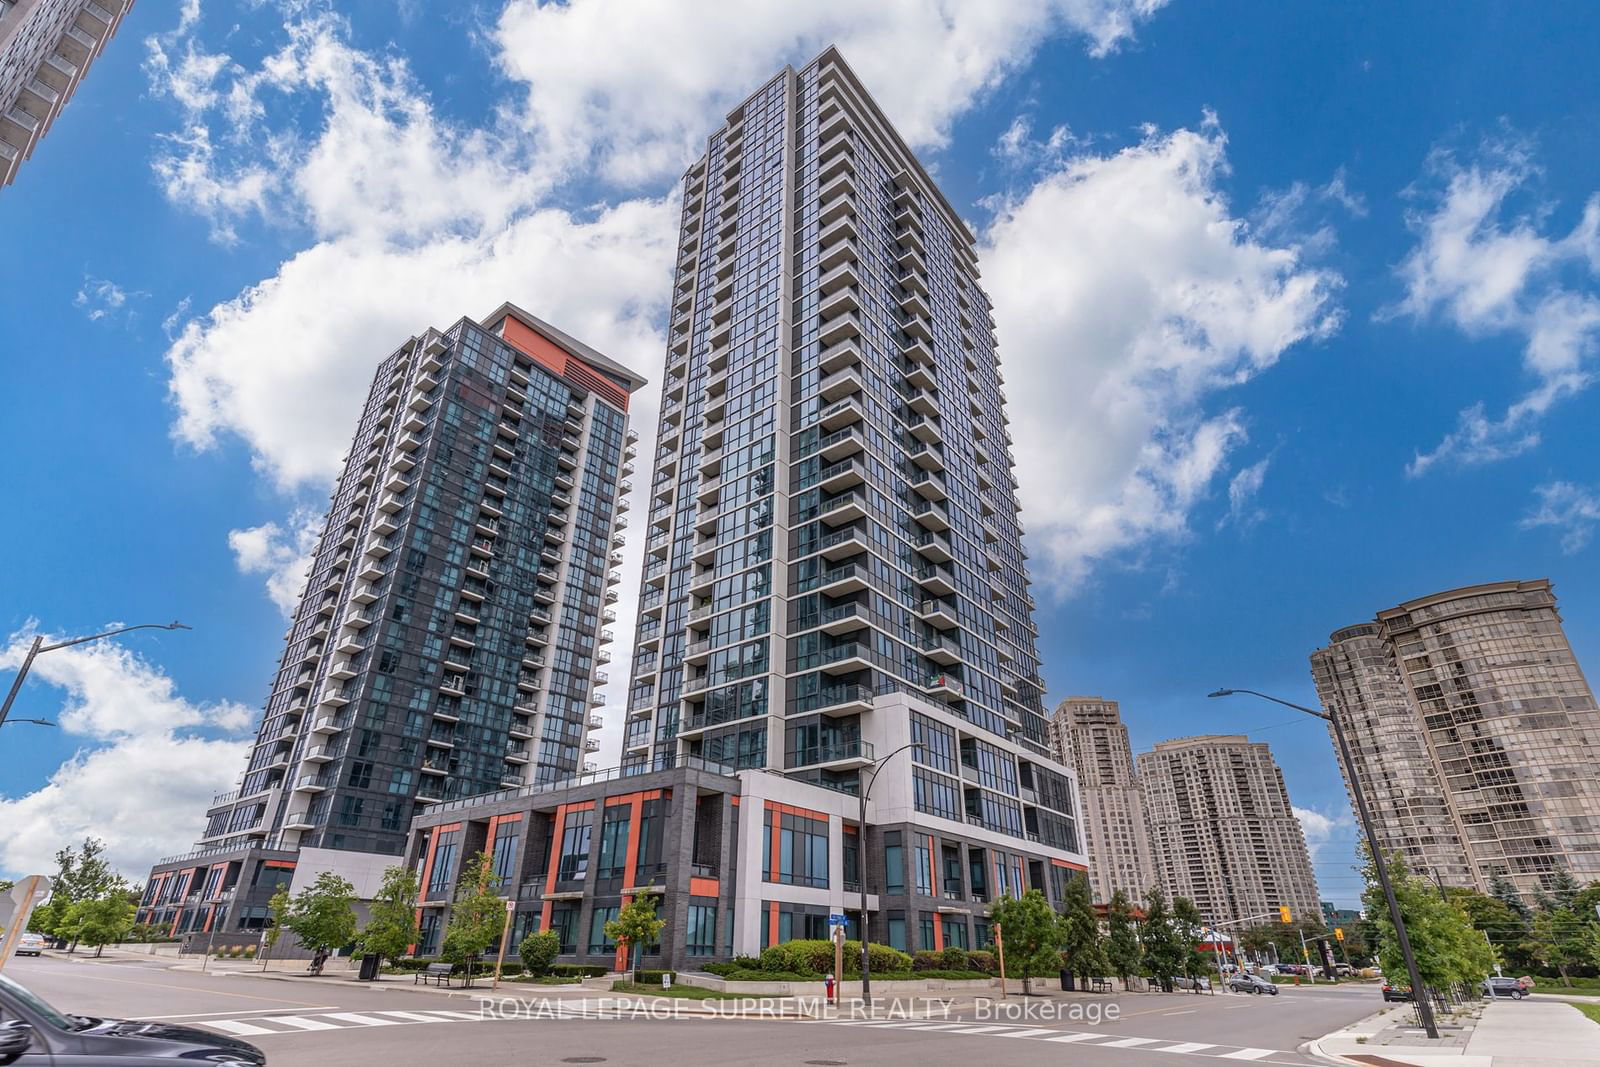
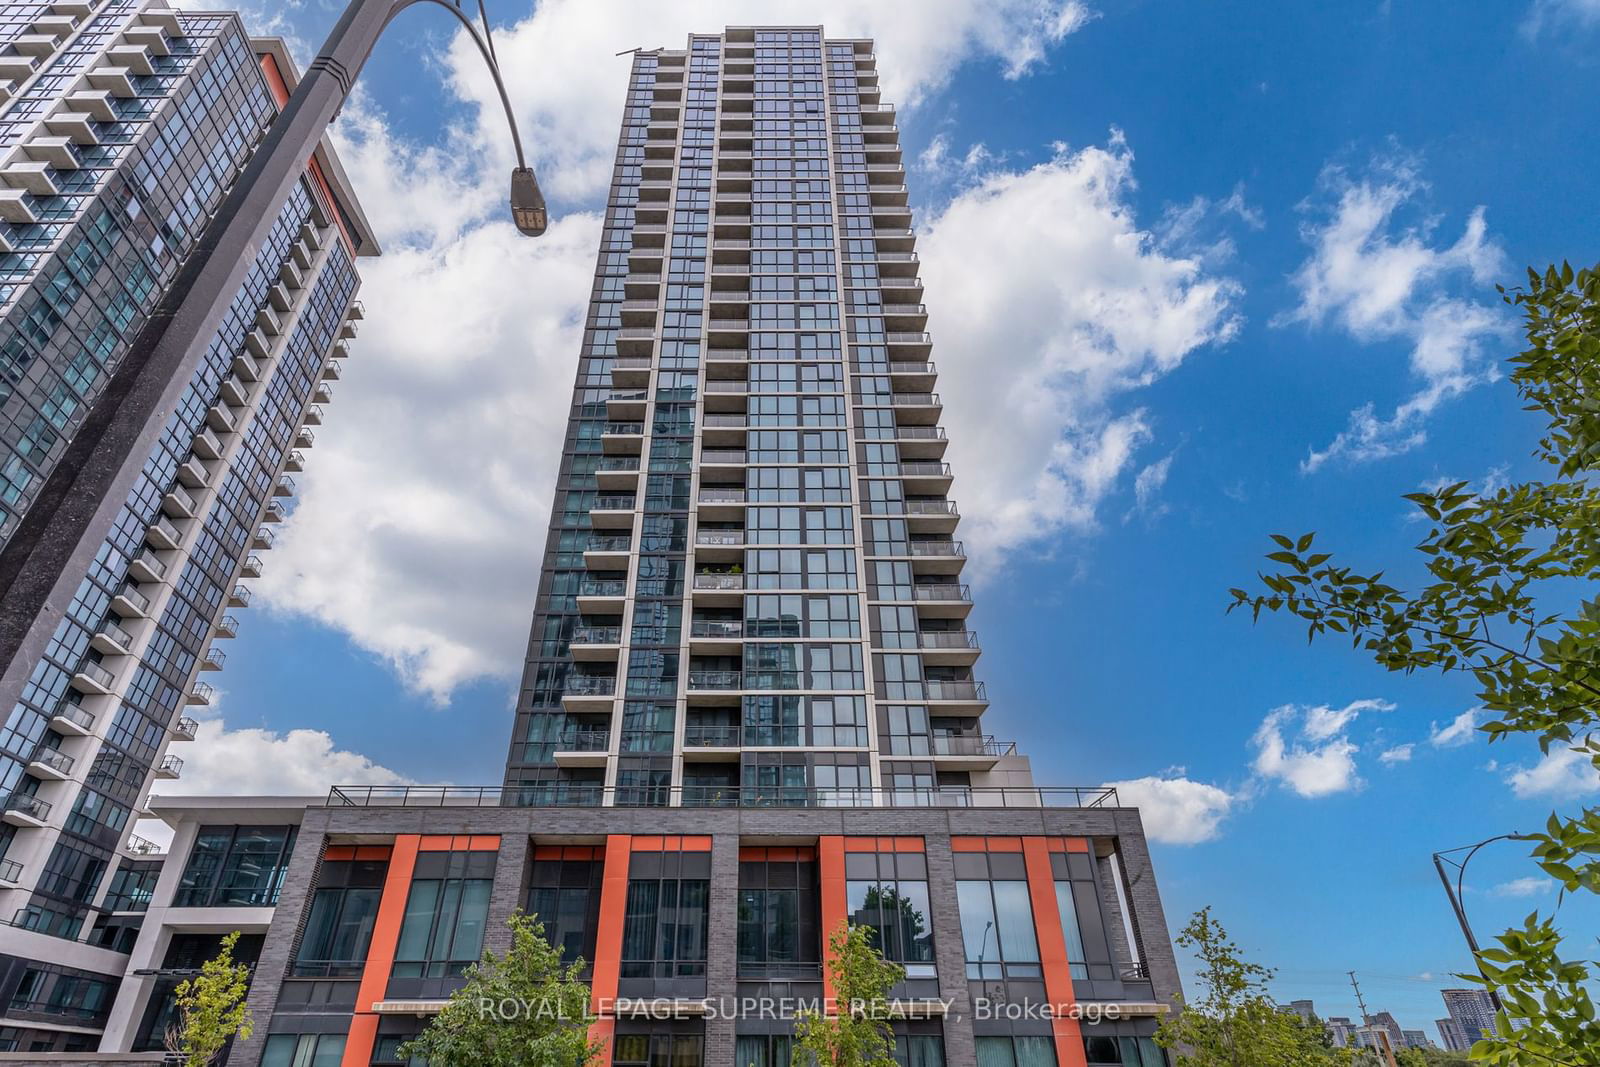
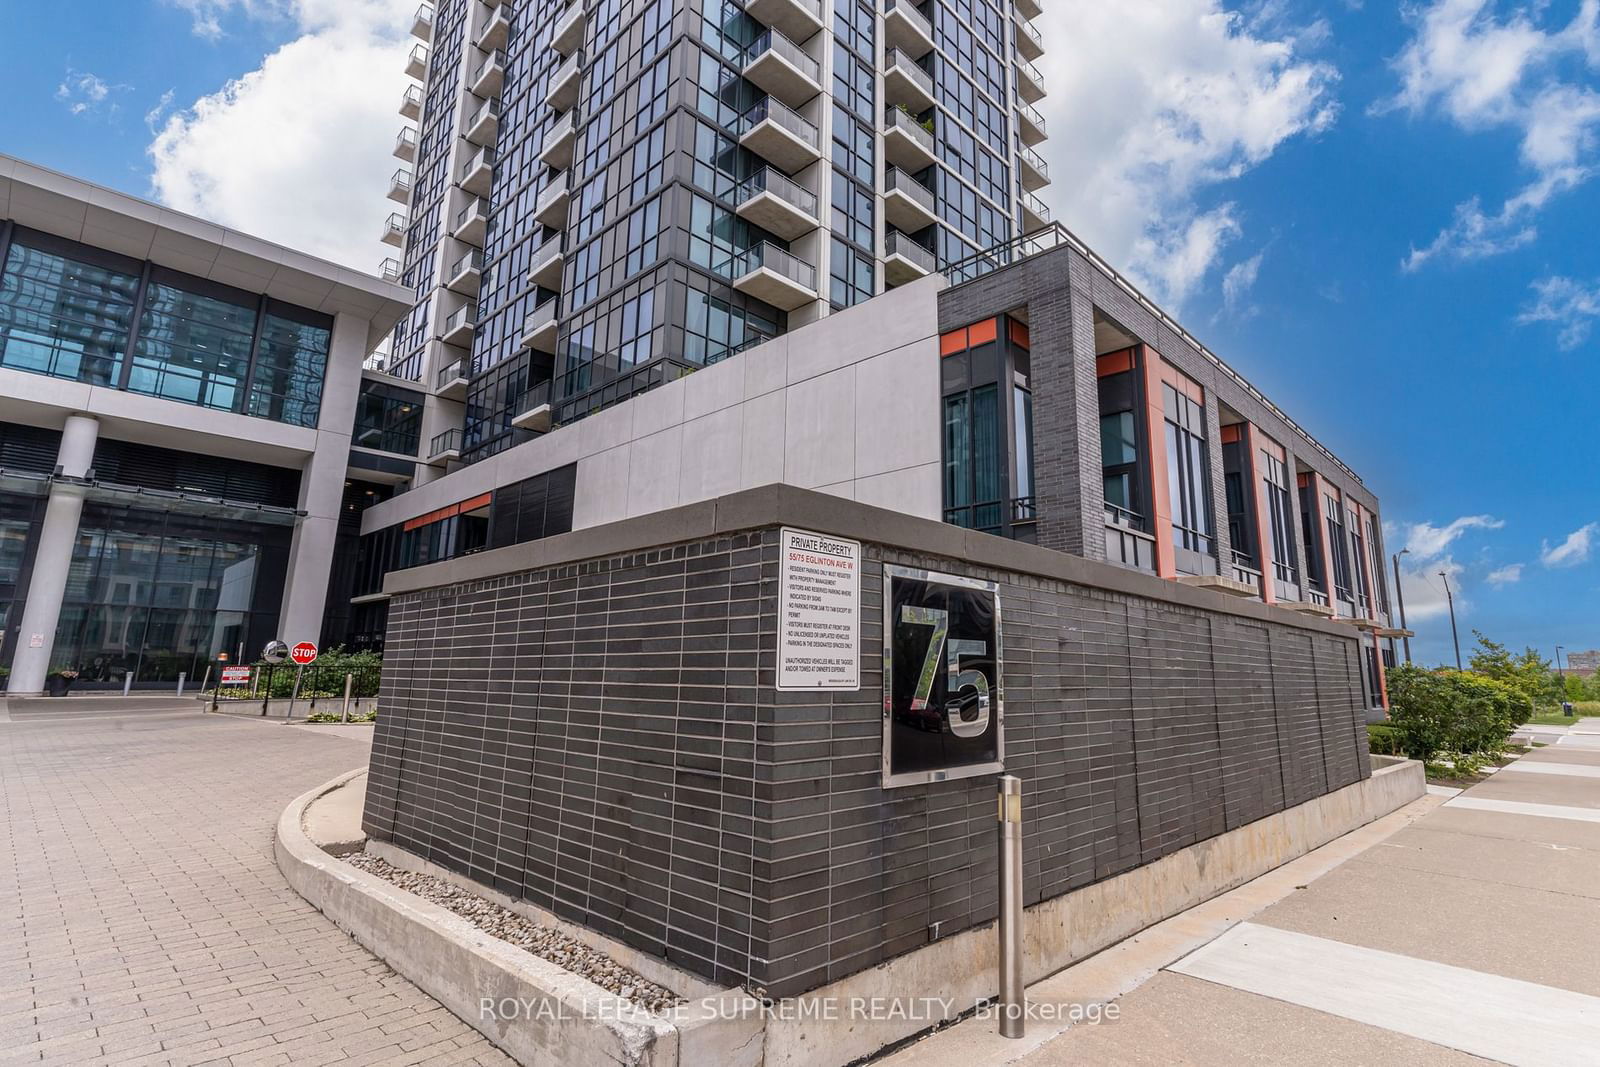
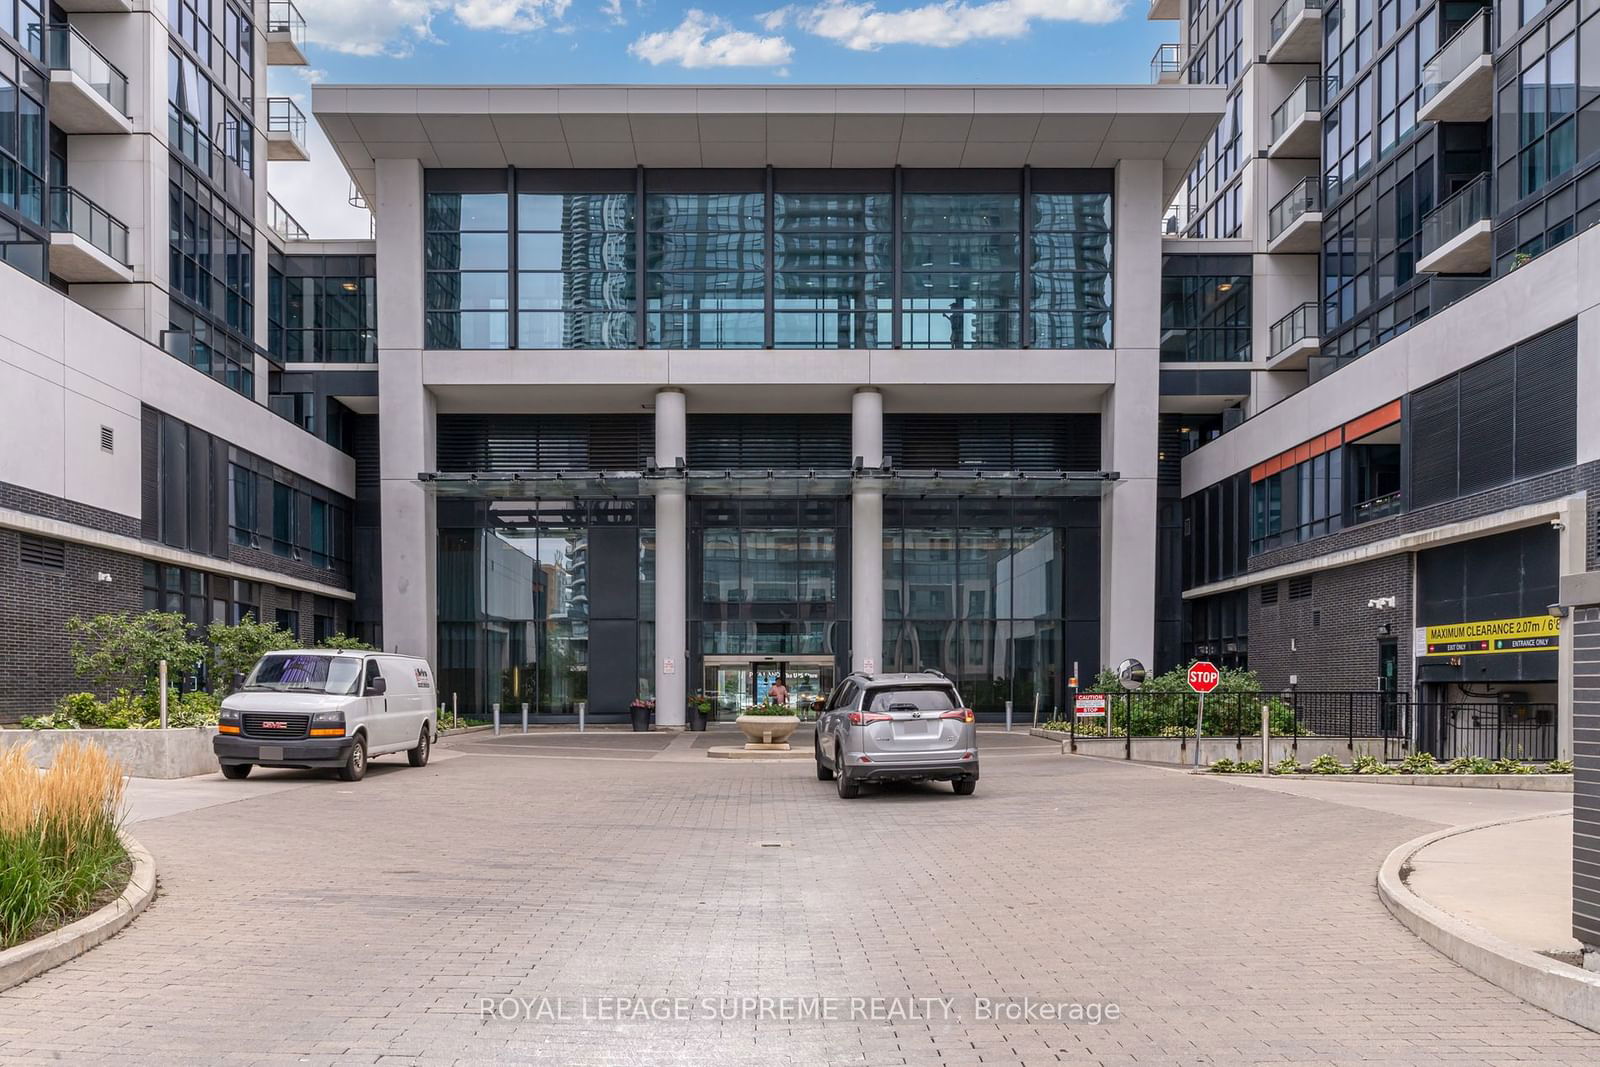
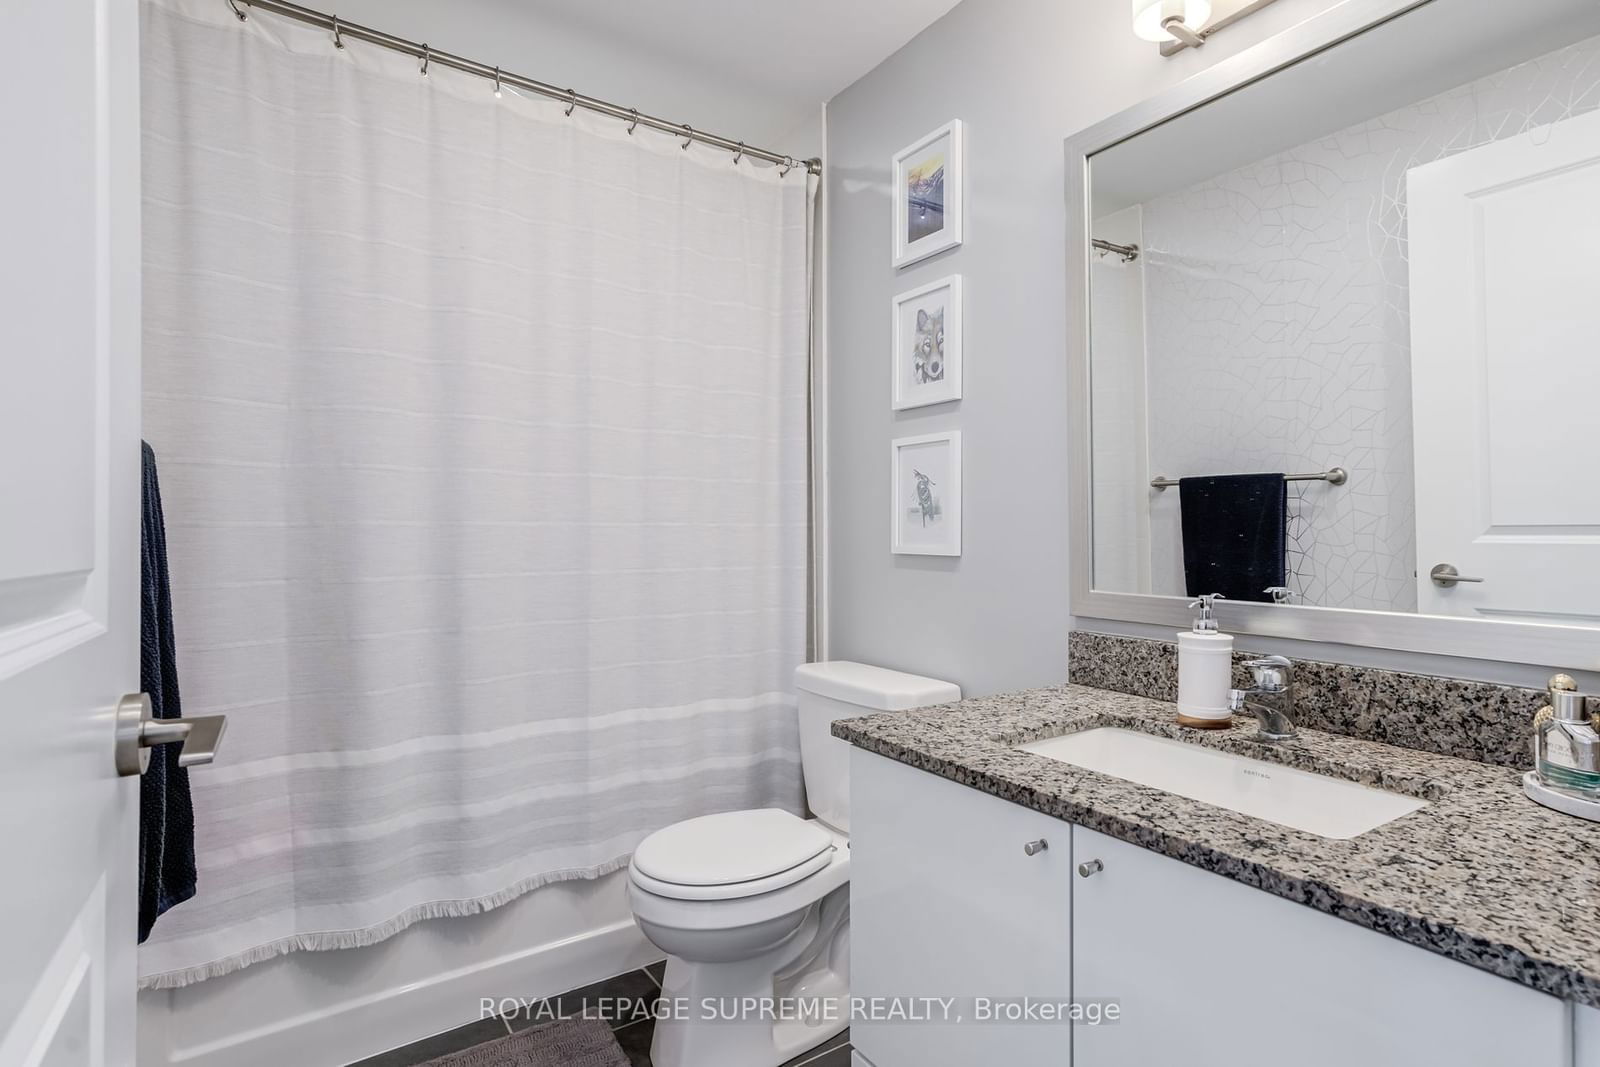
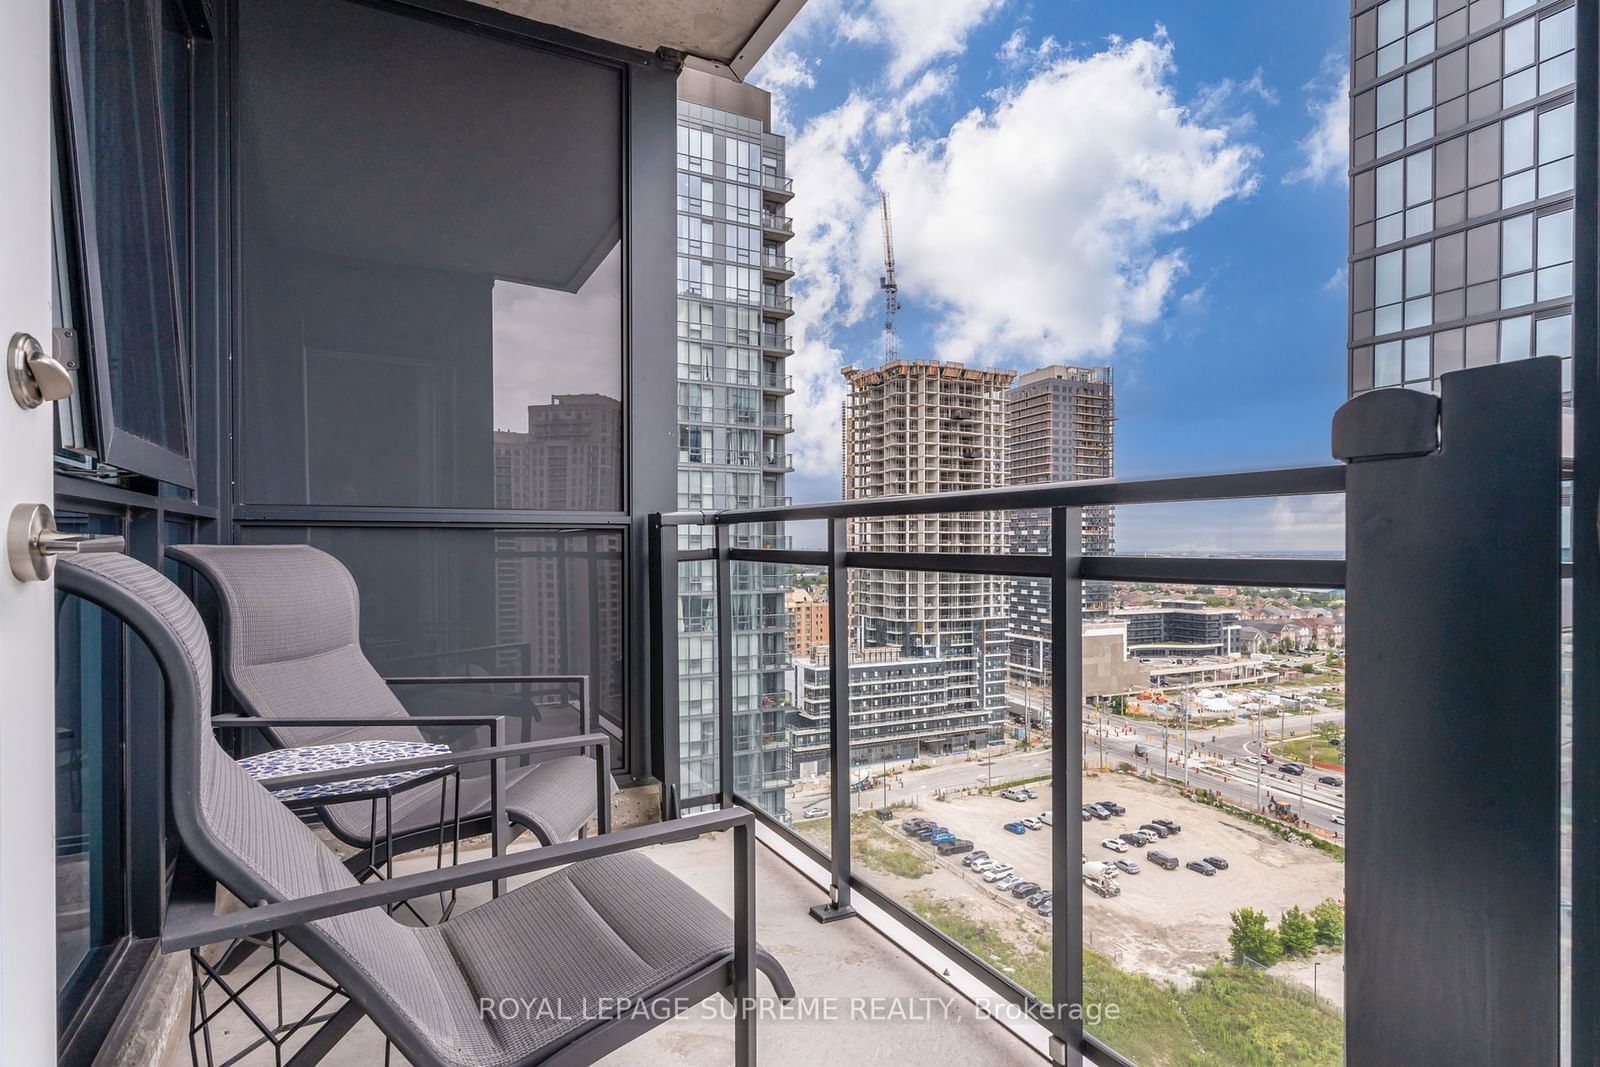
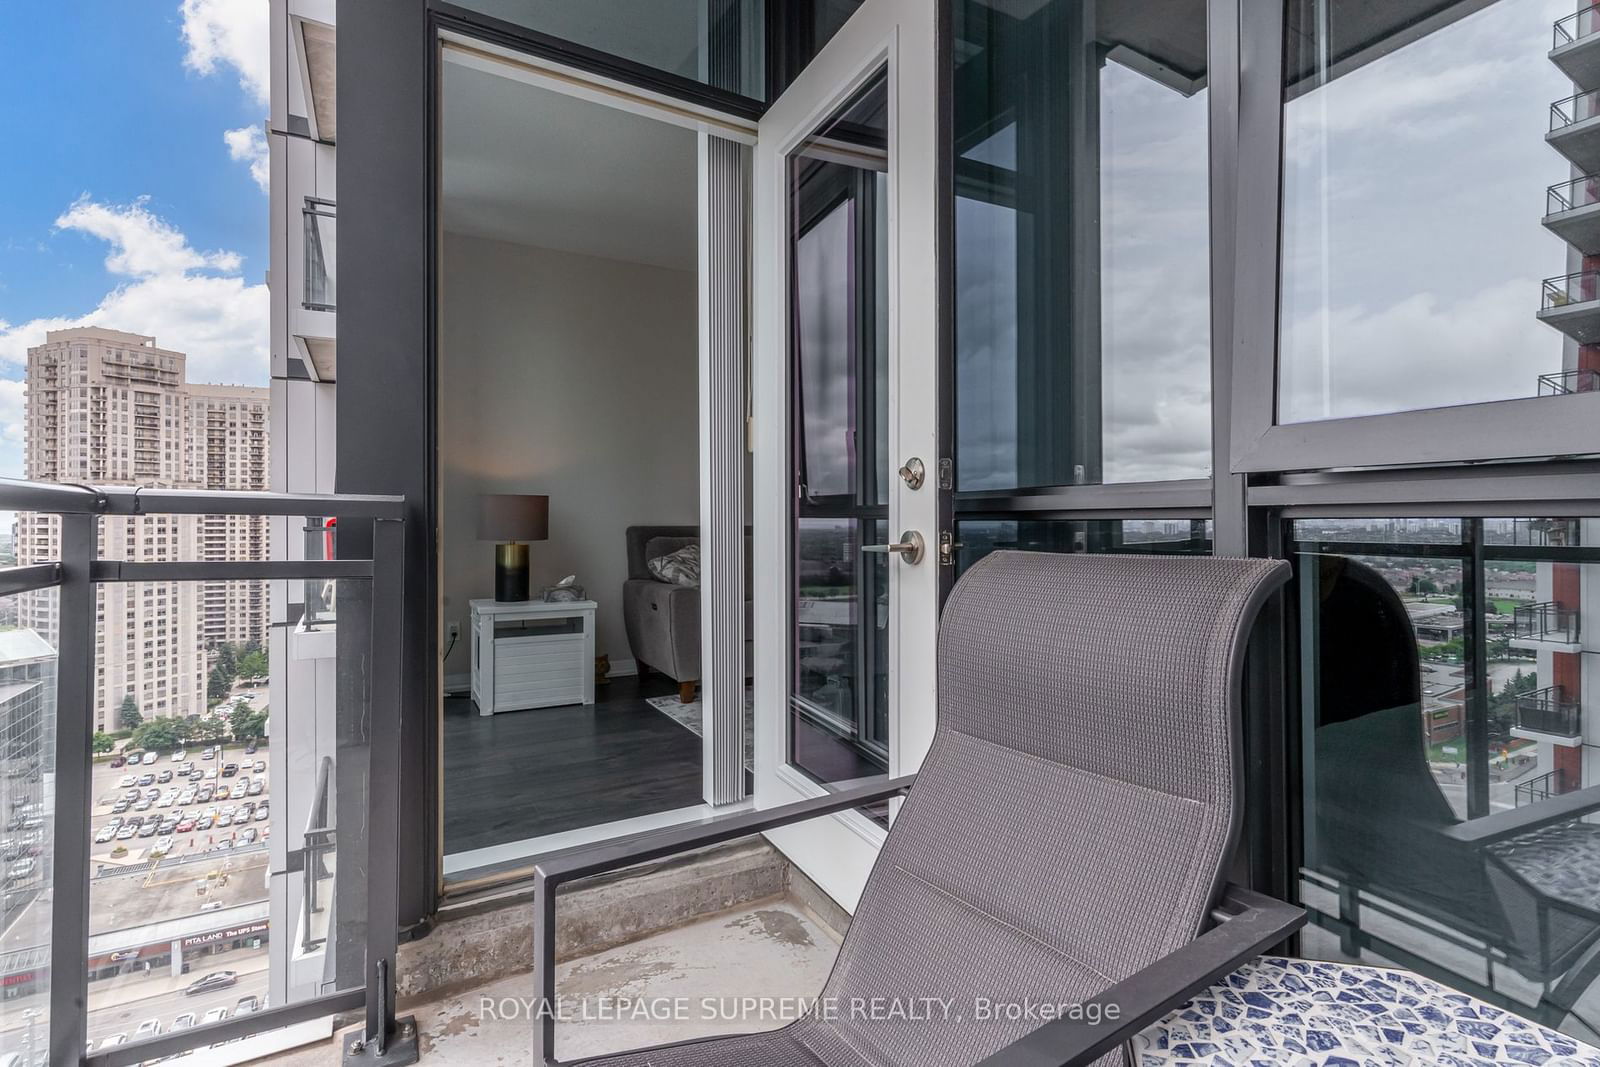
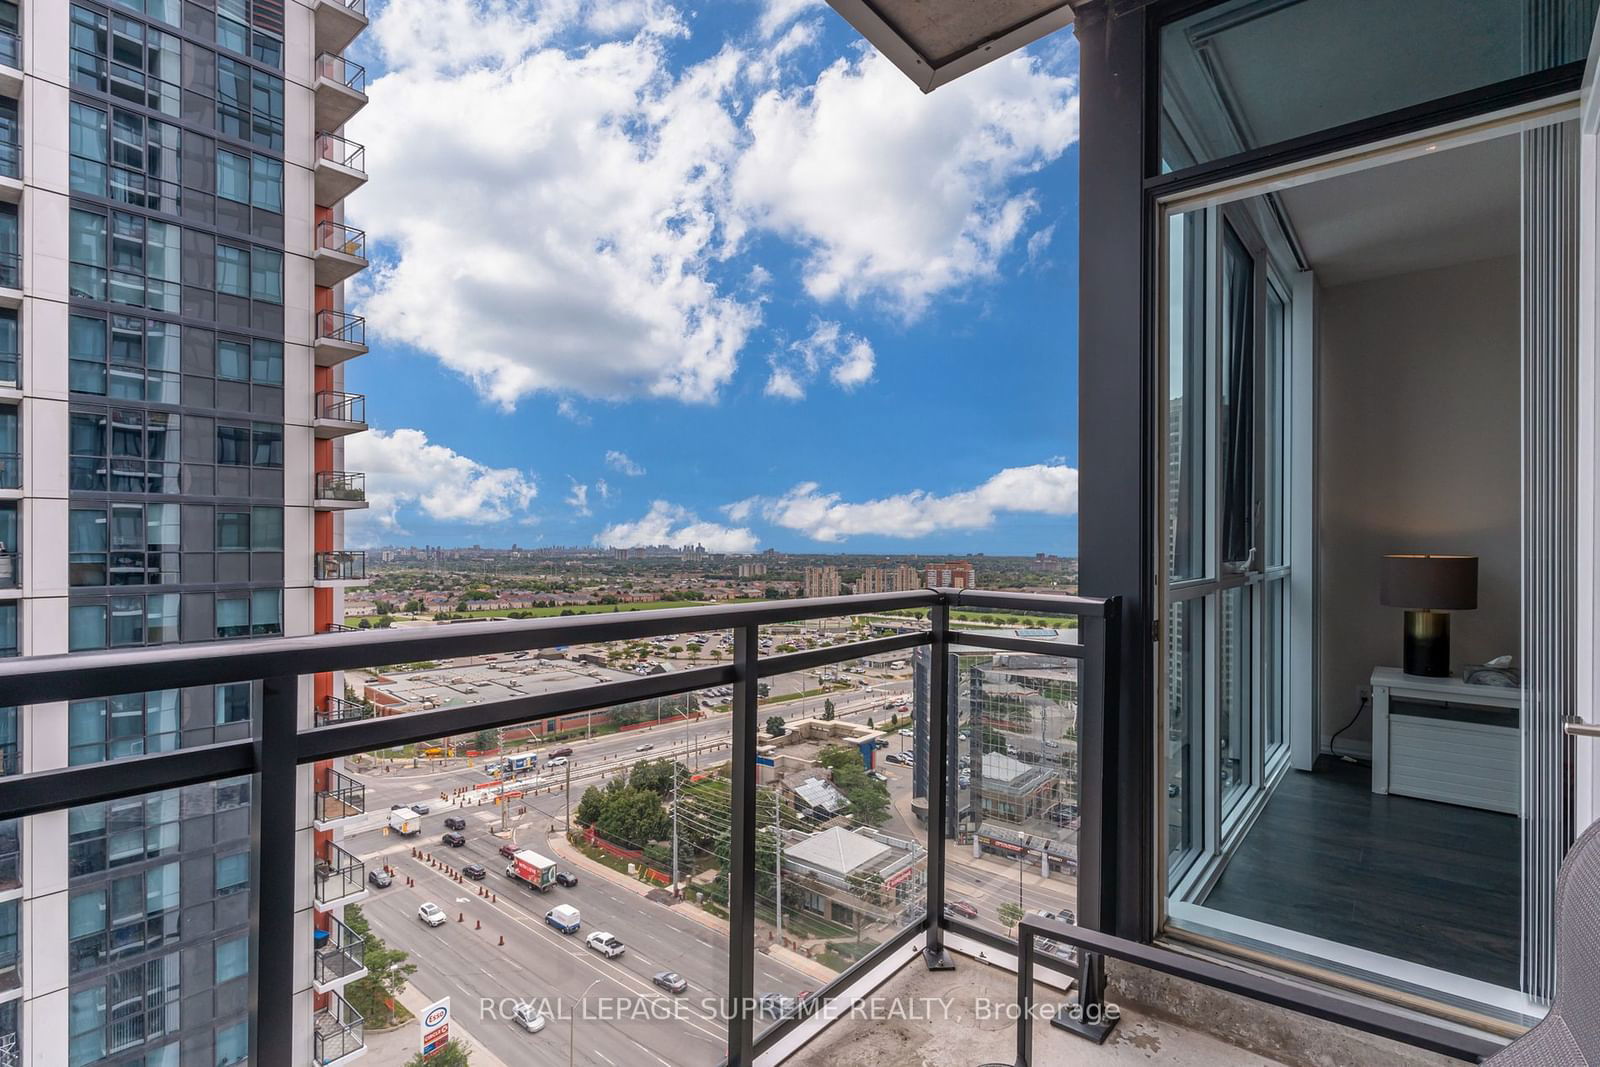
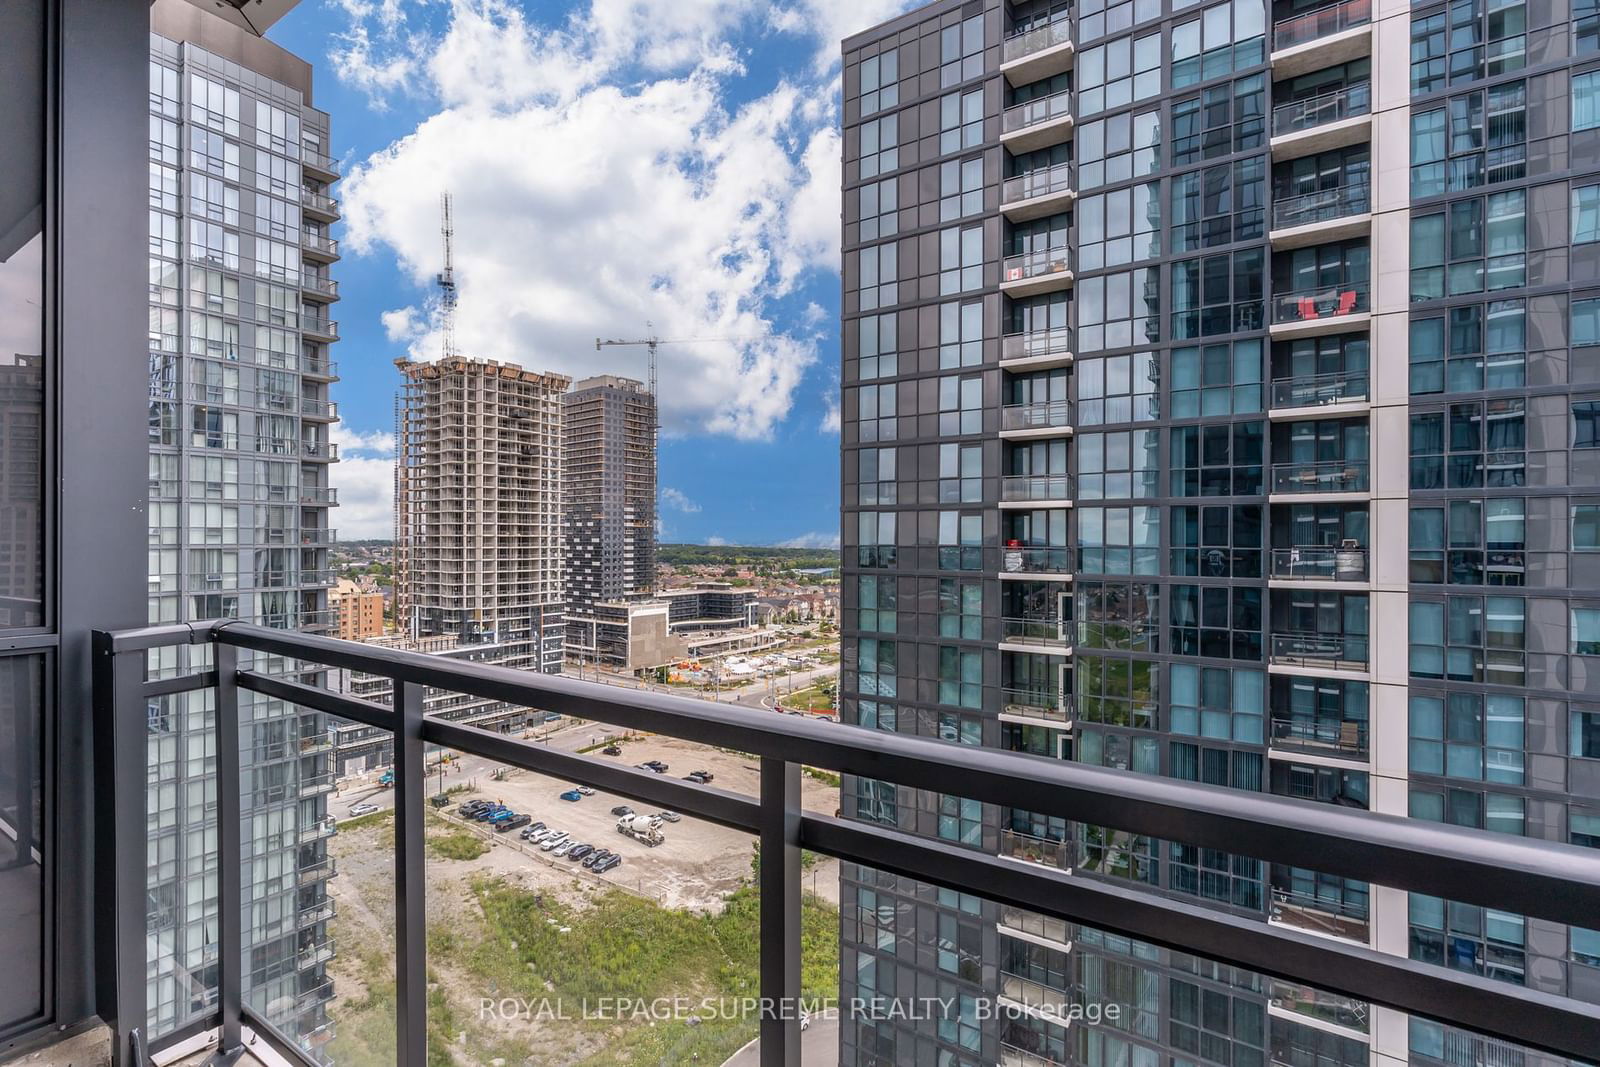
1710 - 75 Eglinton Ave W
Listing History
Unit Highlights
Utilities Included
Utility Type
- Air Conditioning
- Central Air
- Heat Source
- Gas
- Heating
- Forced Air
Room Dimensions
About this Listing
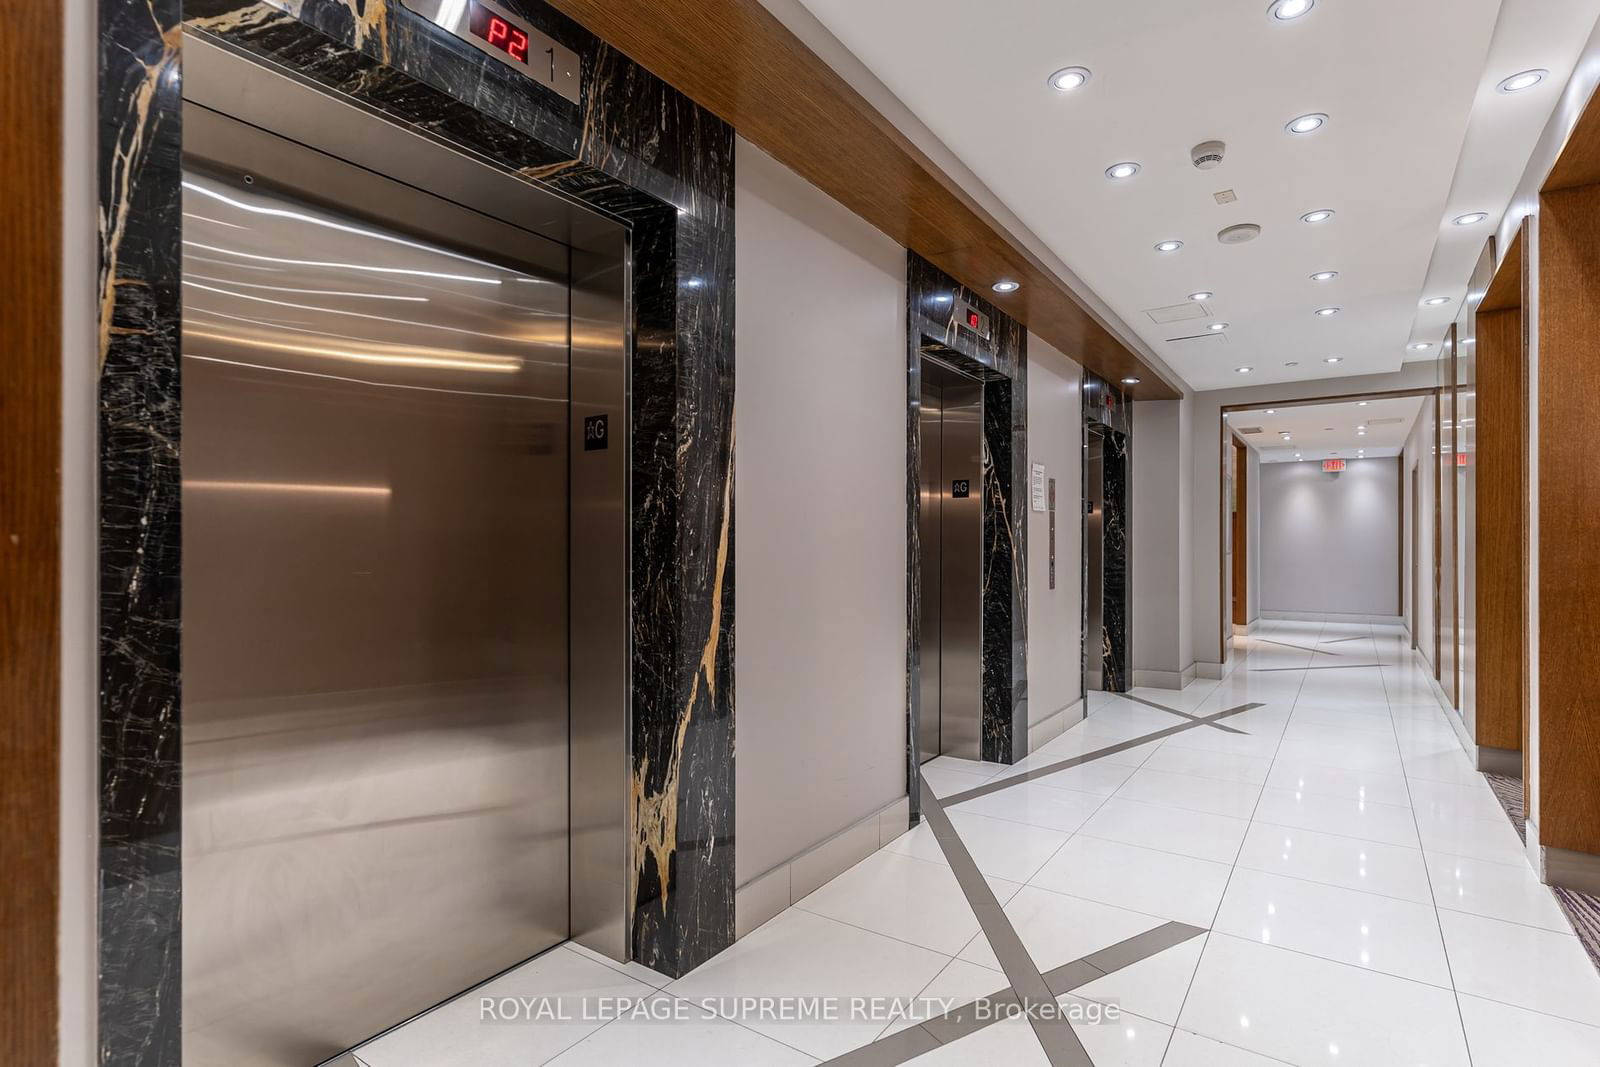
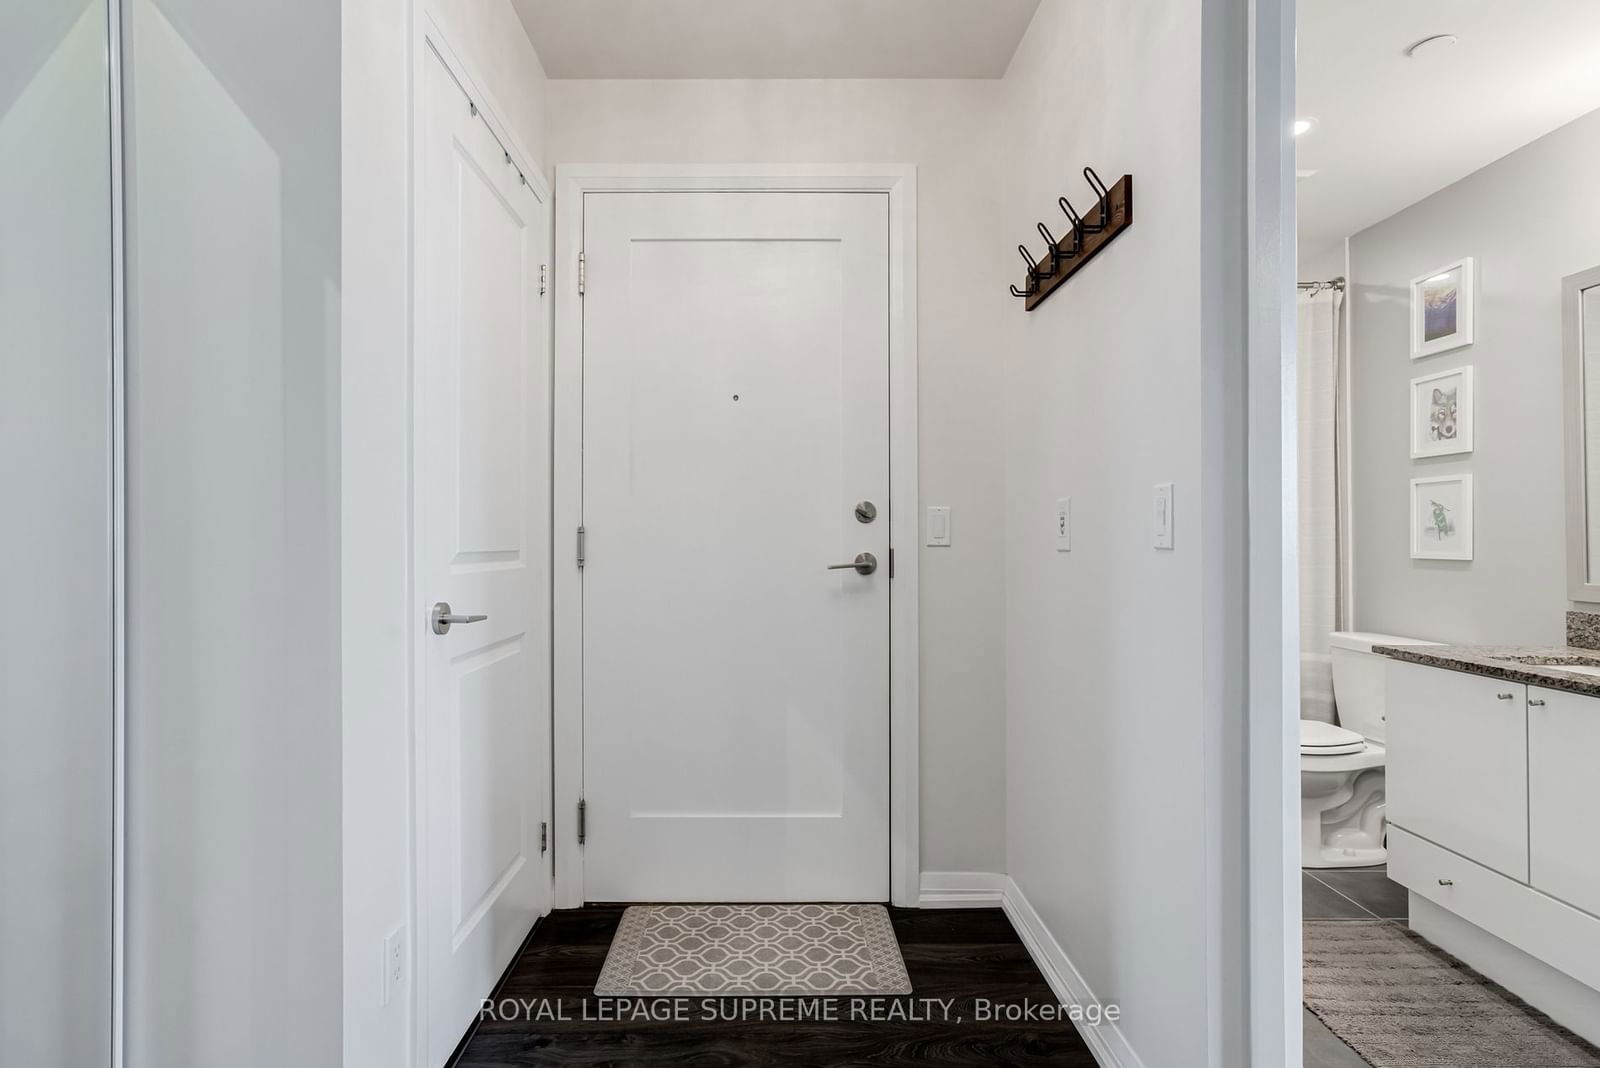
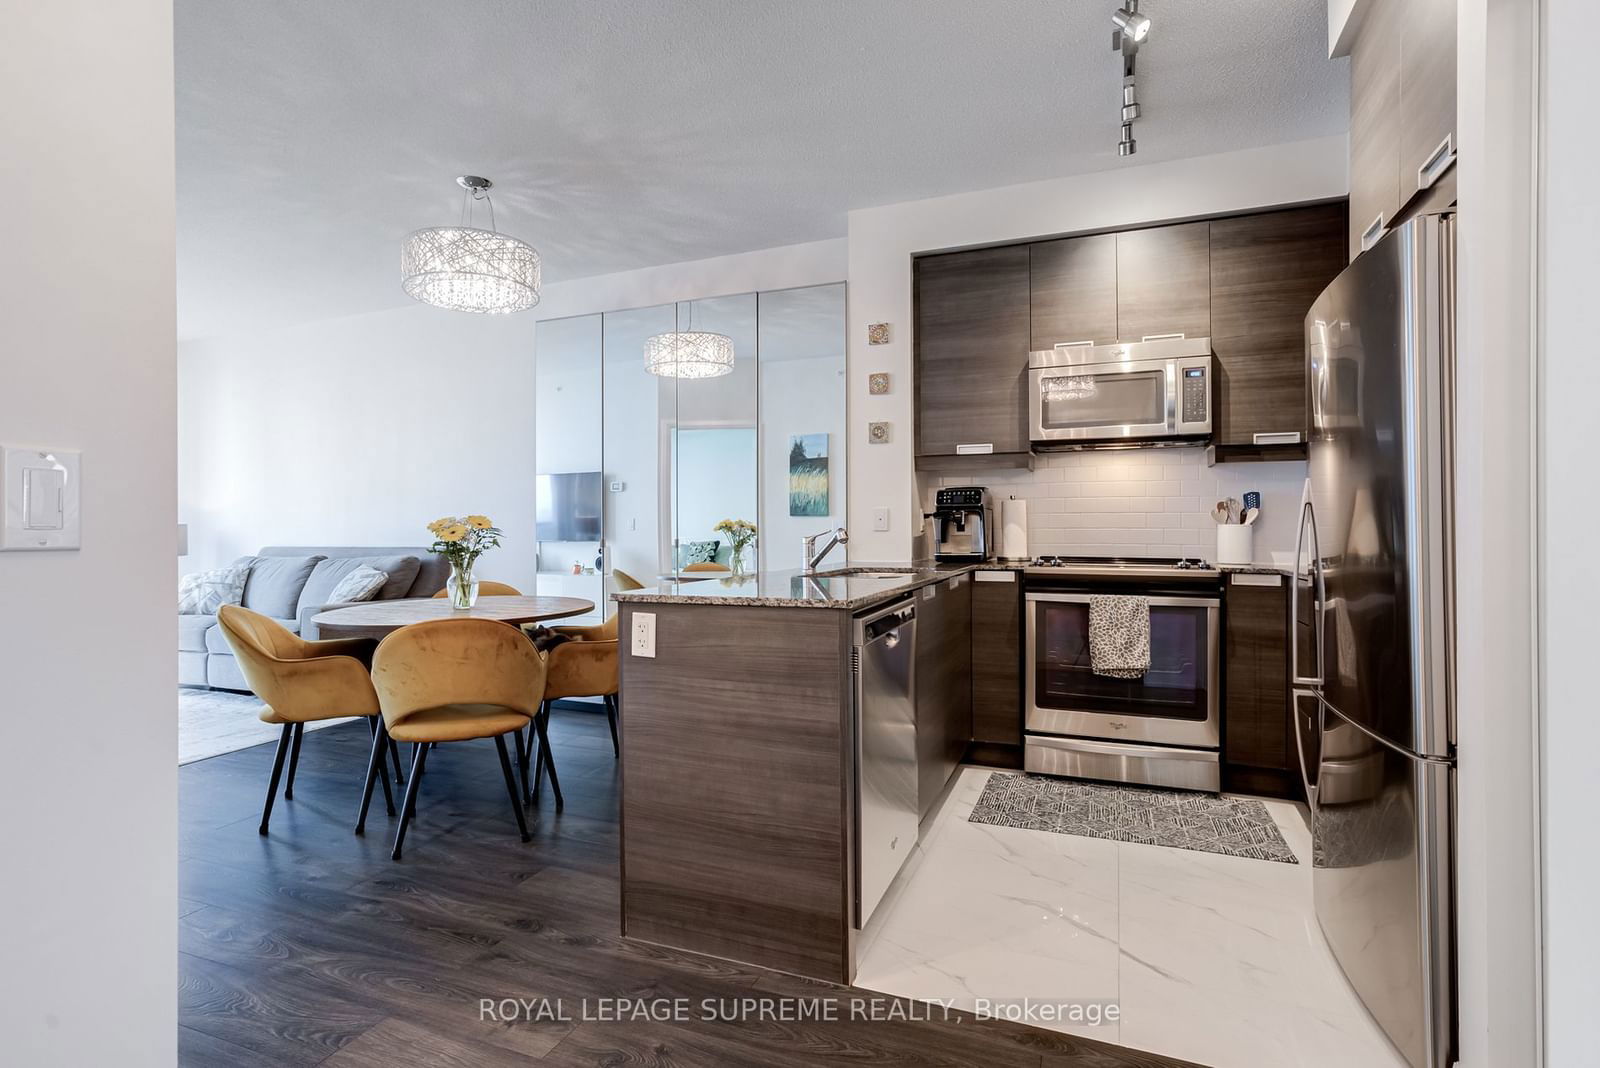
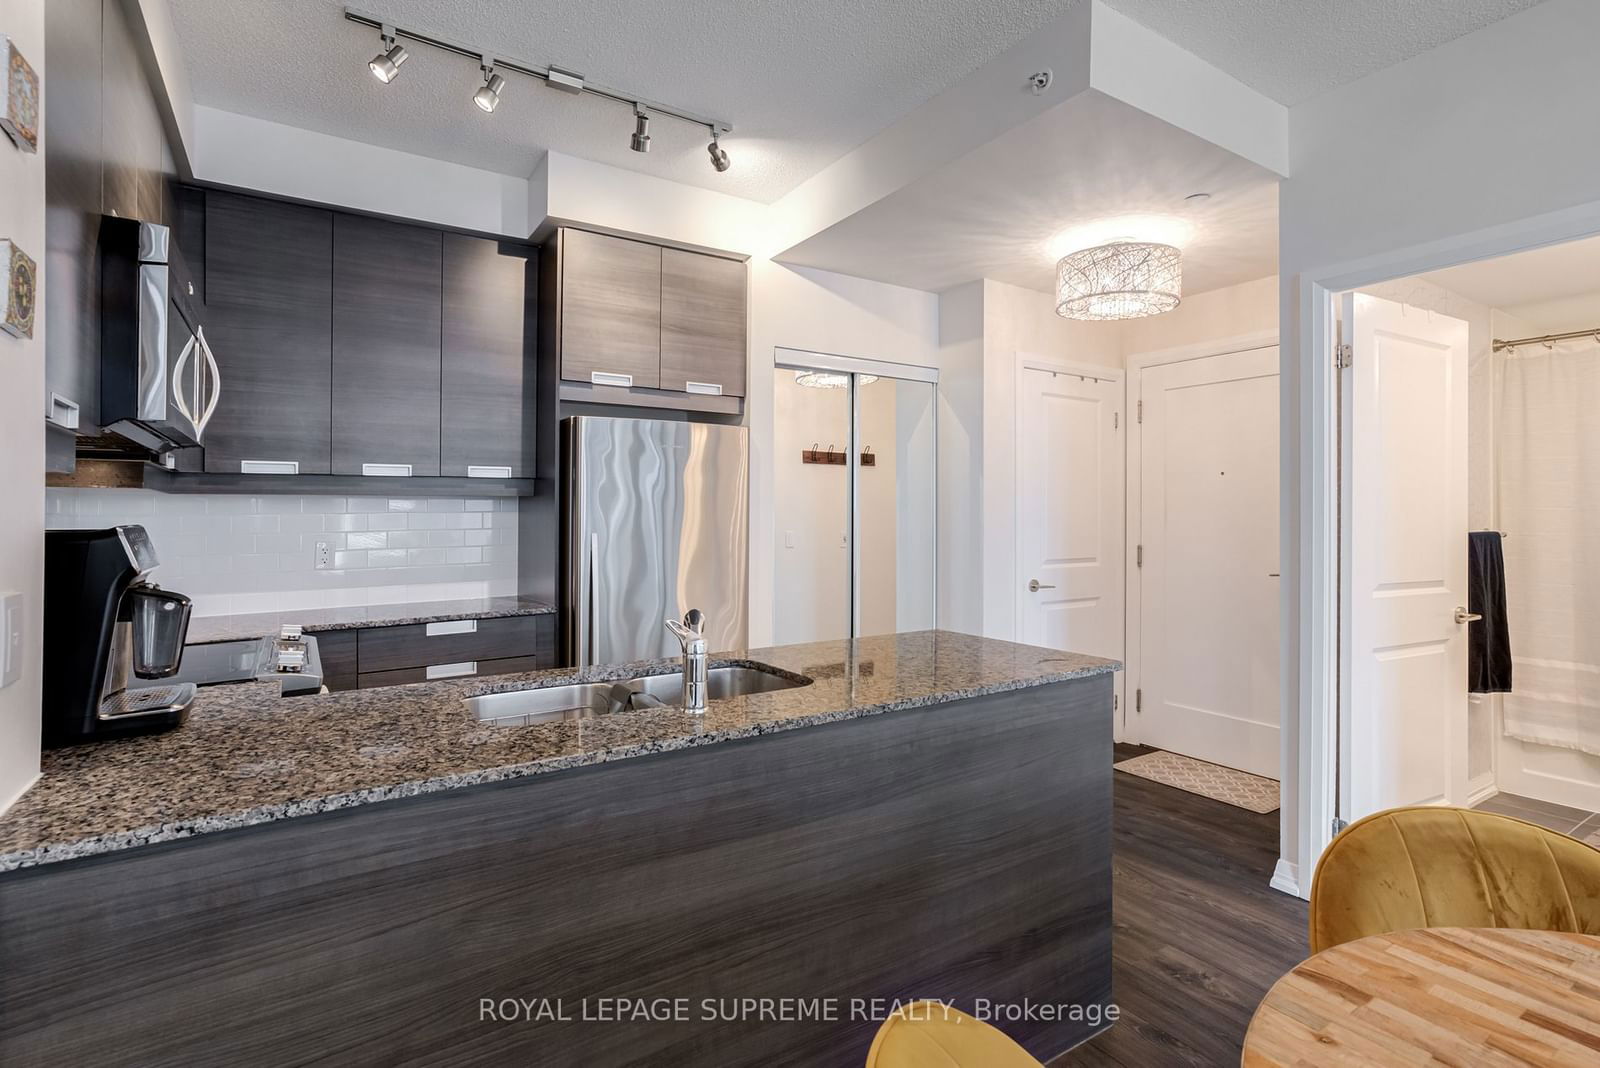
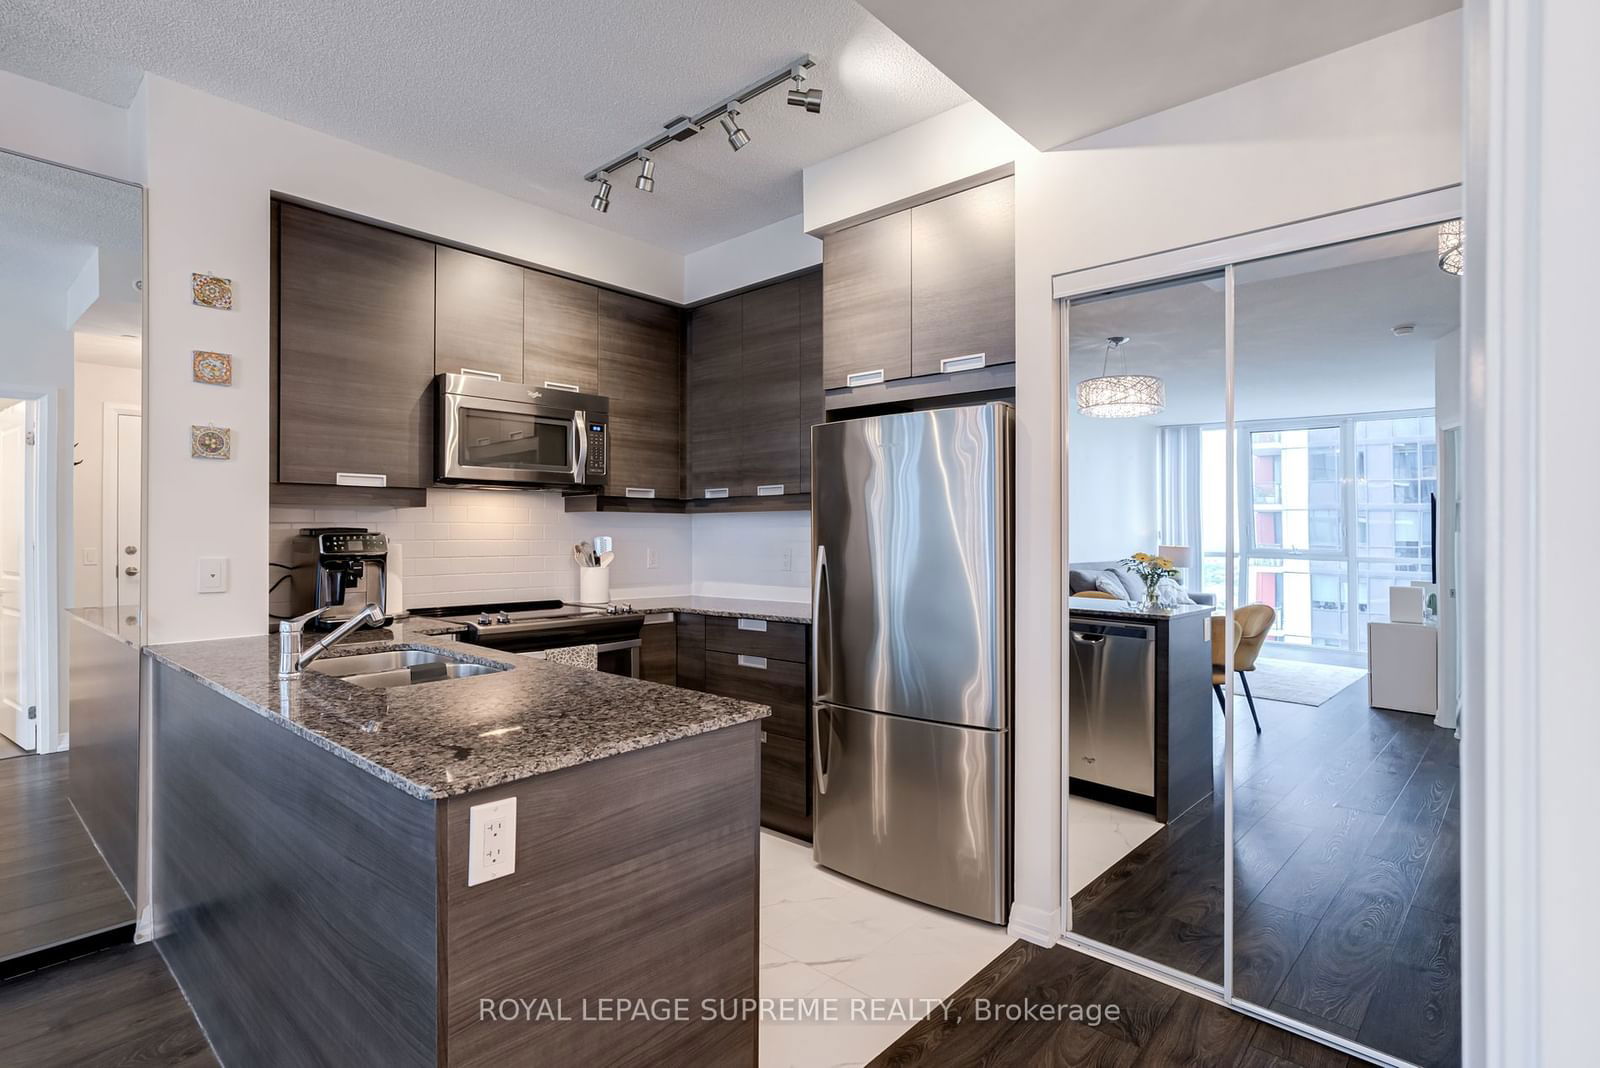
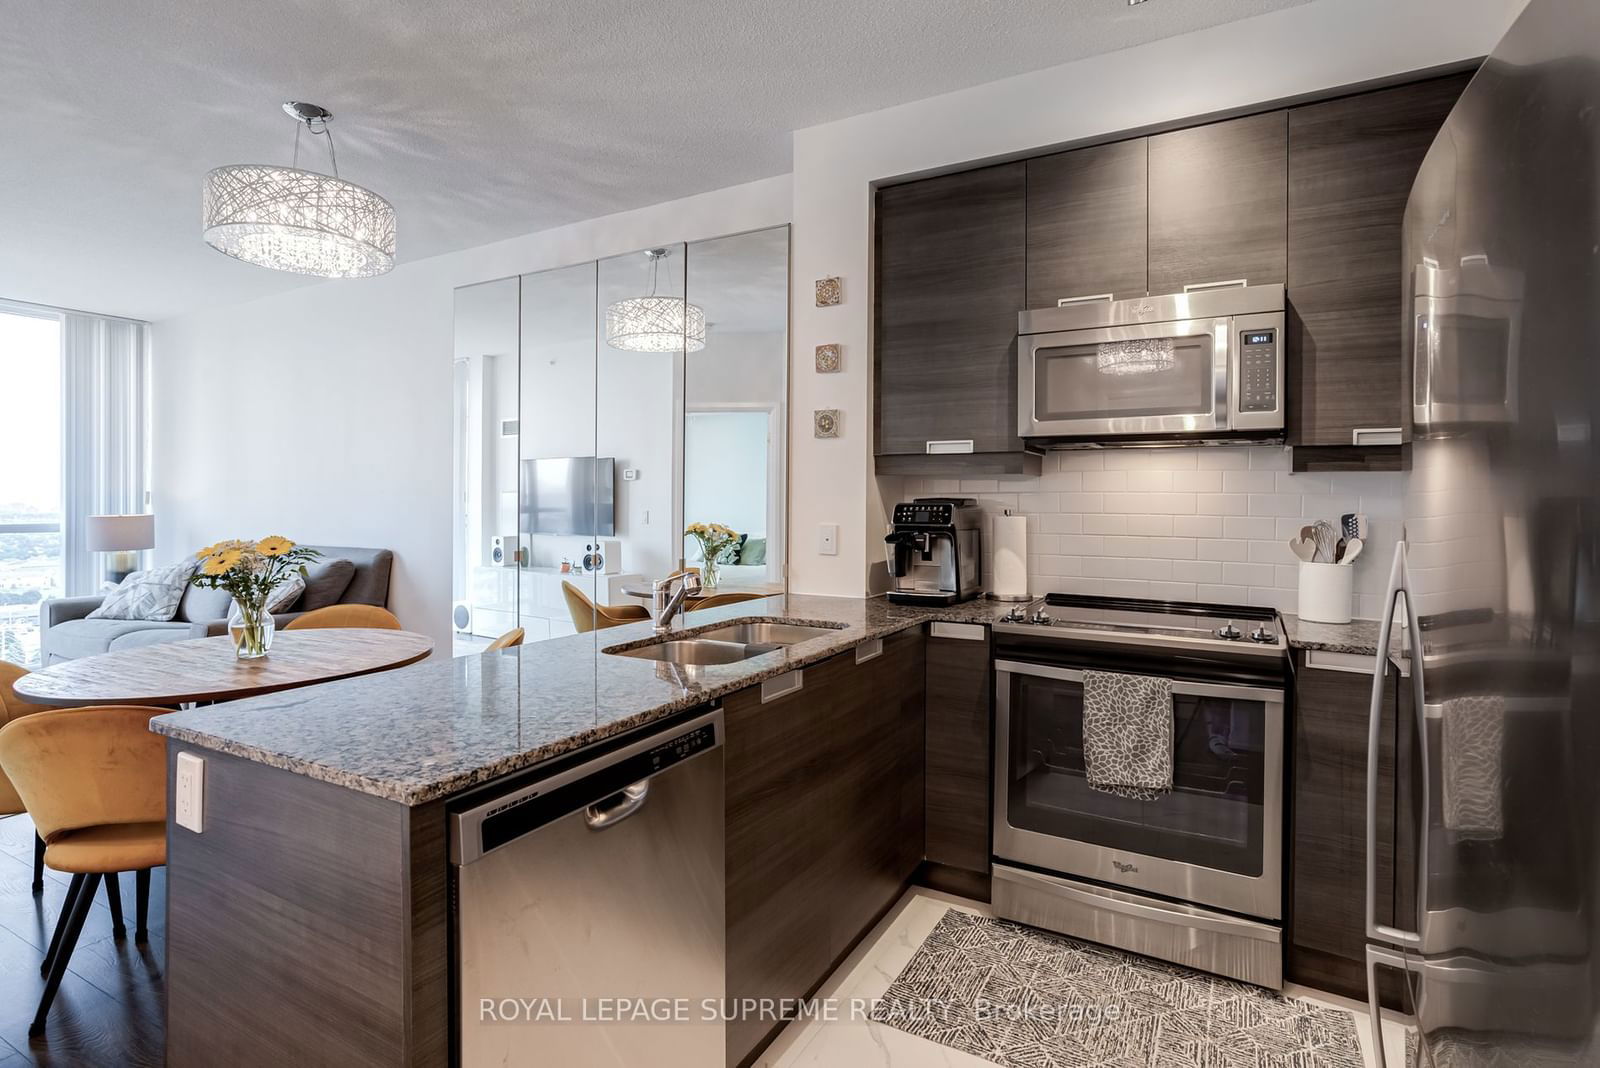
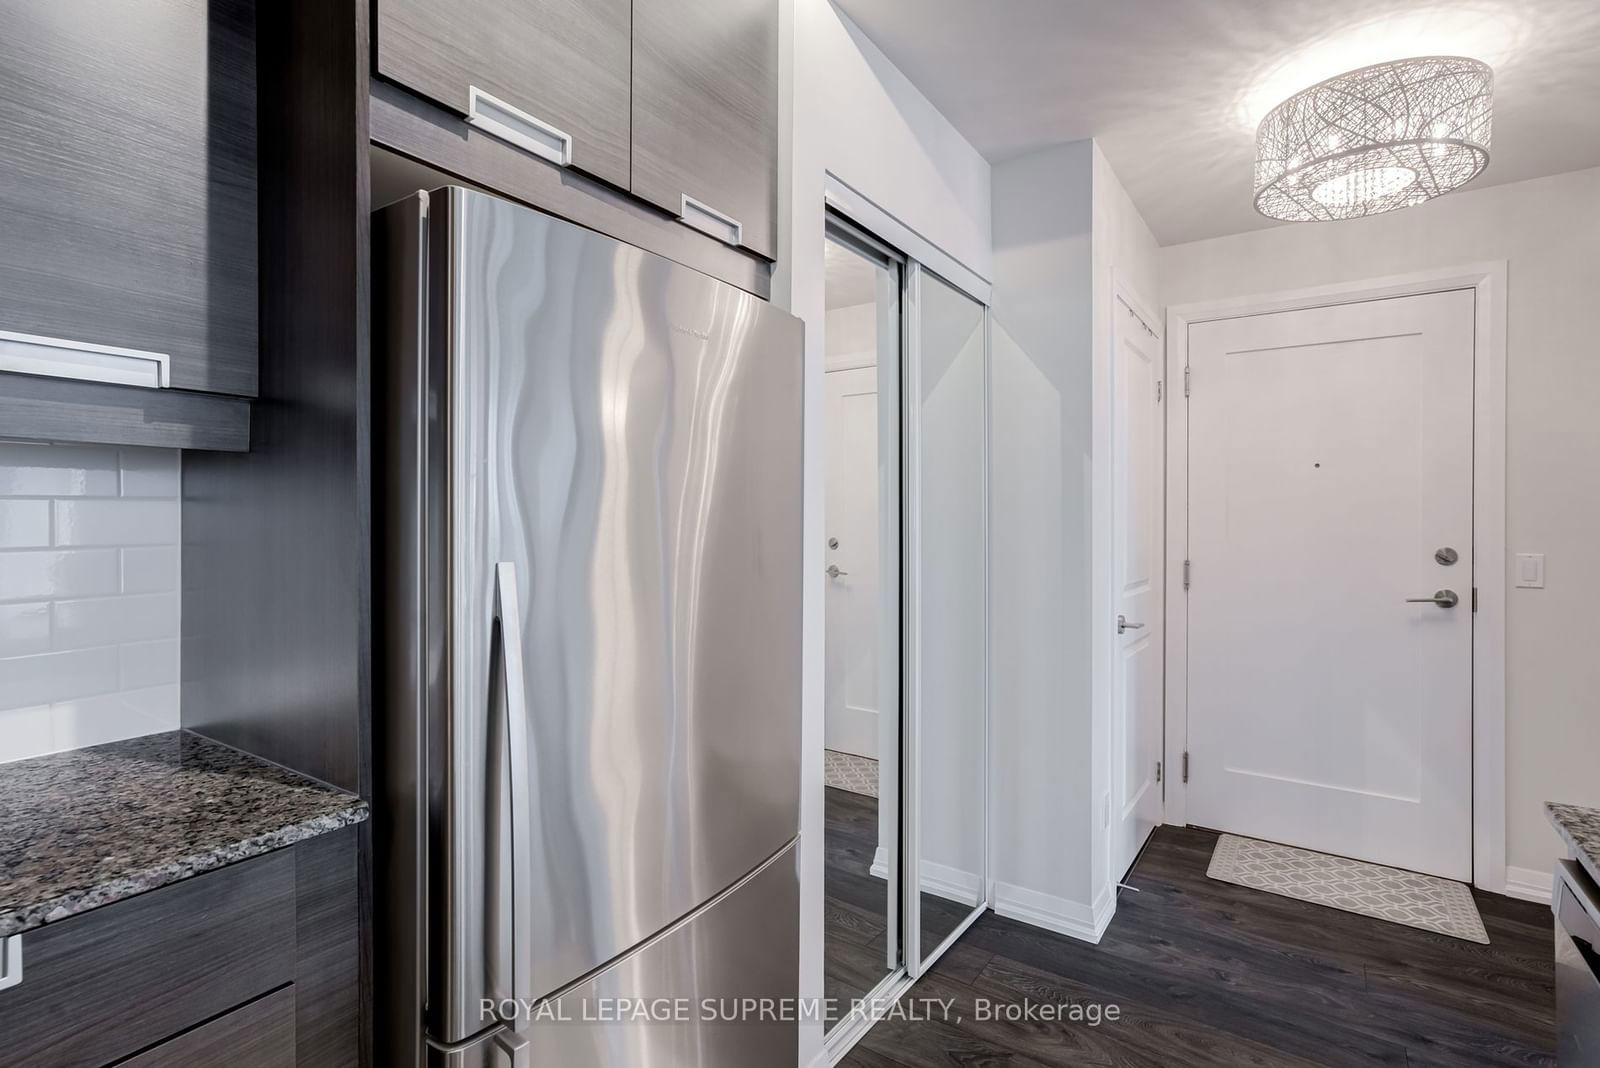
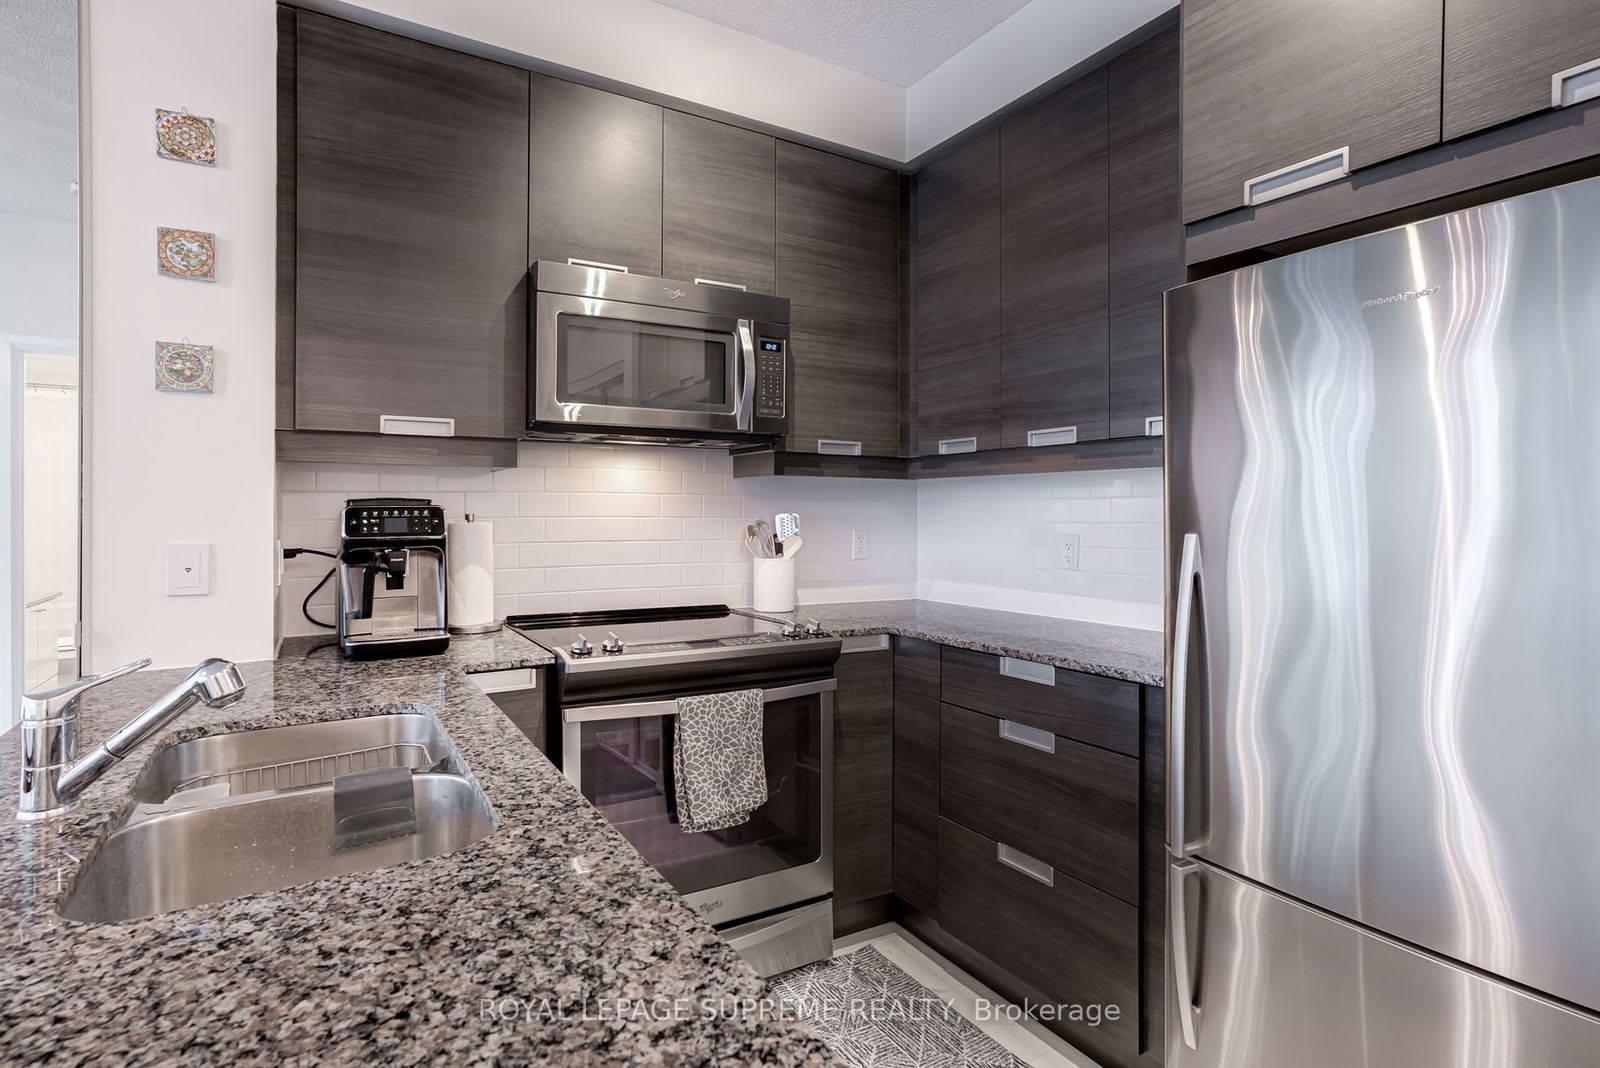
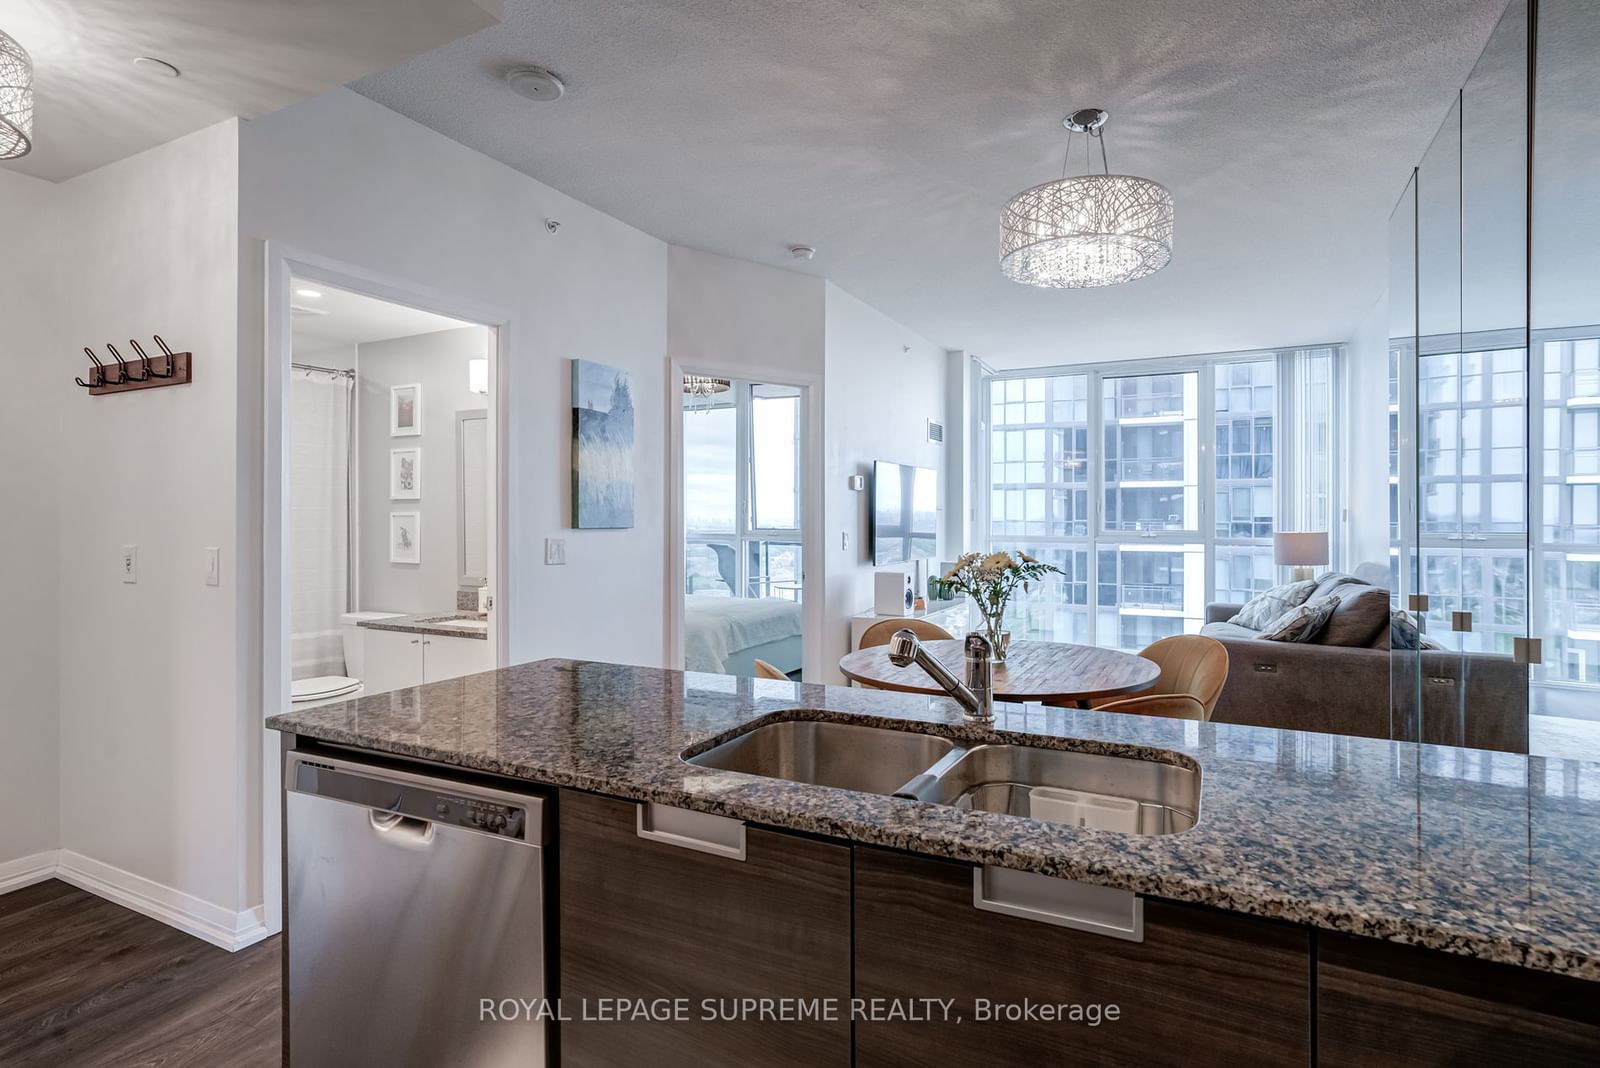
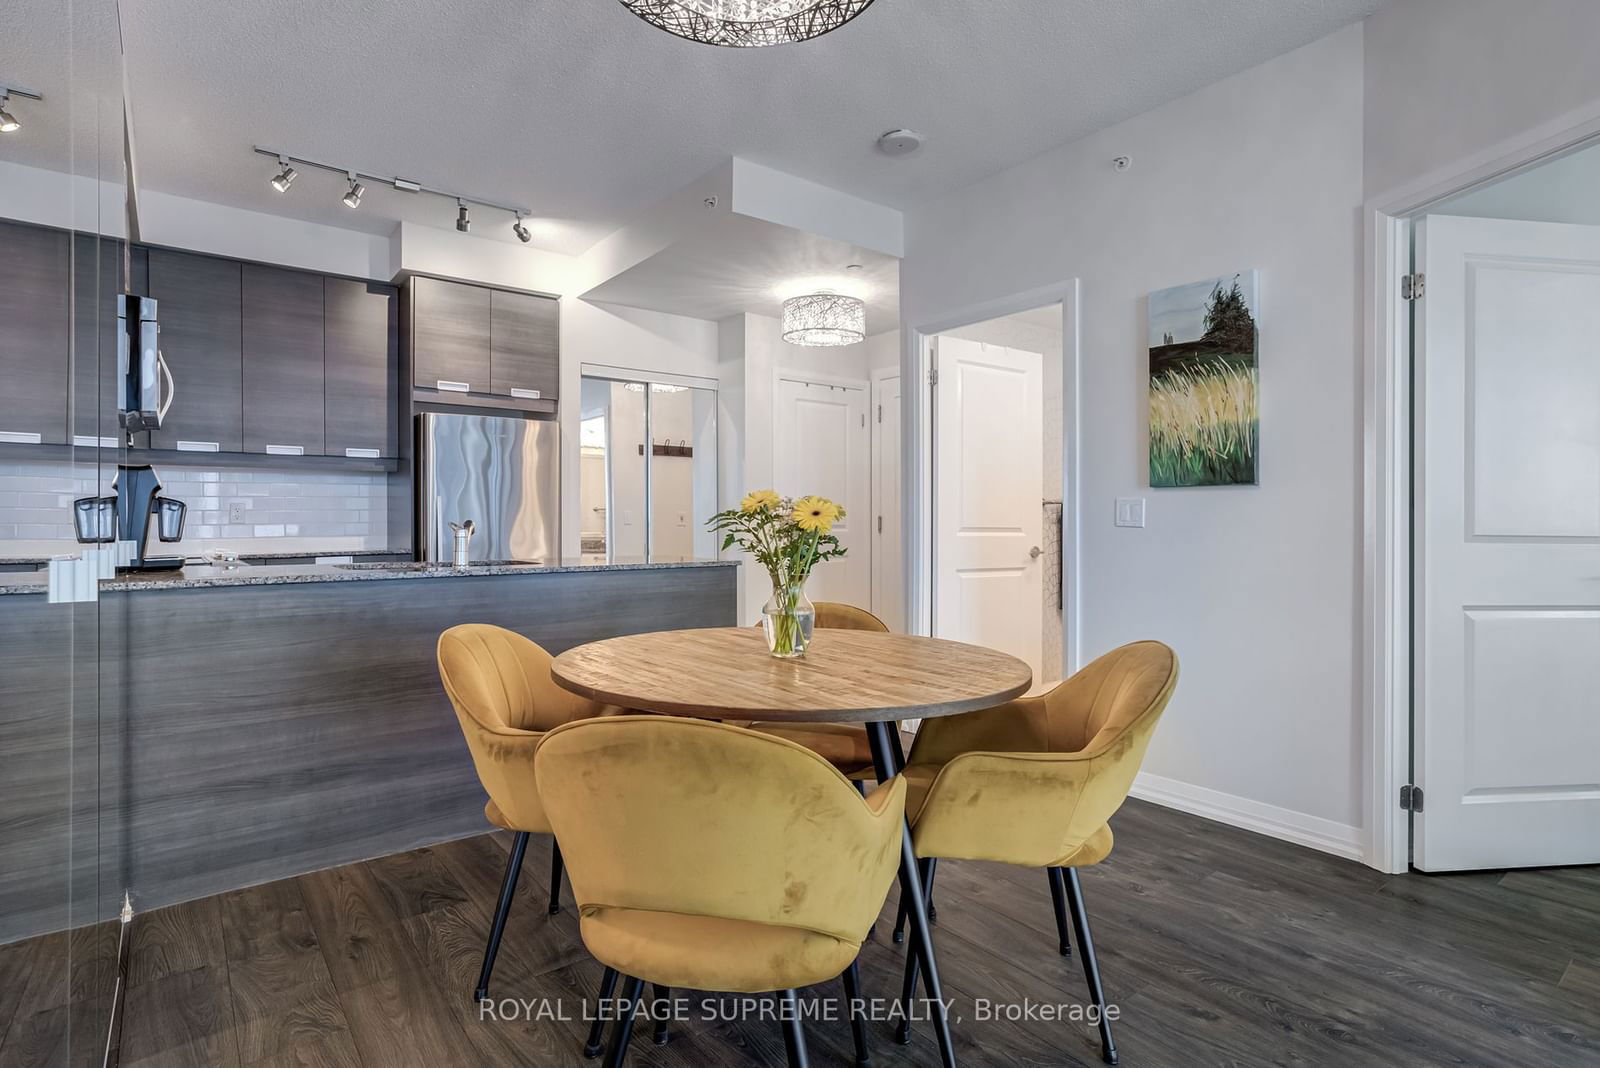
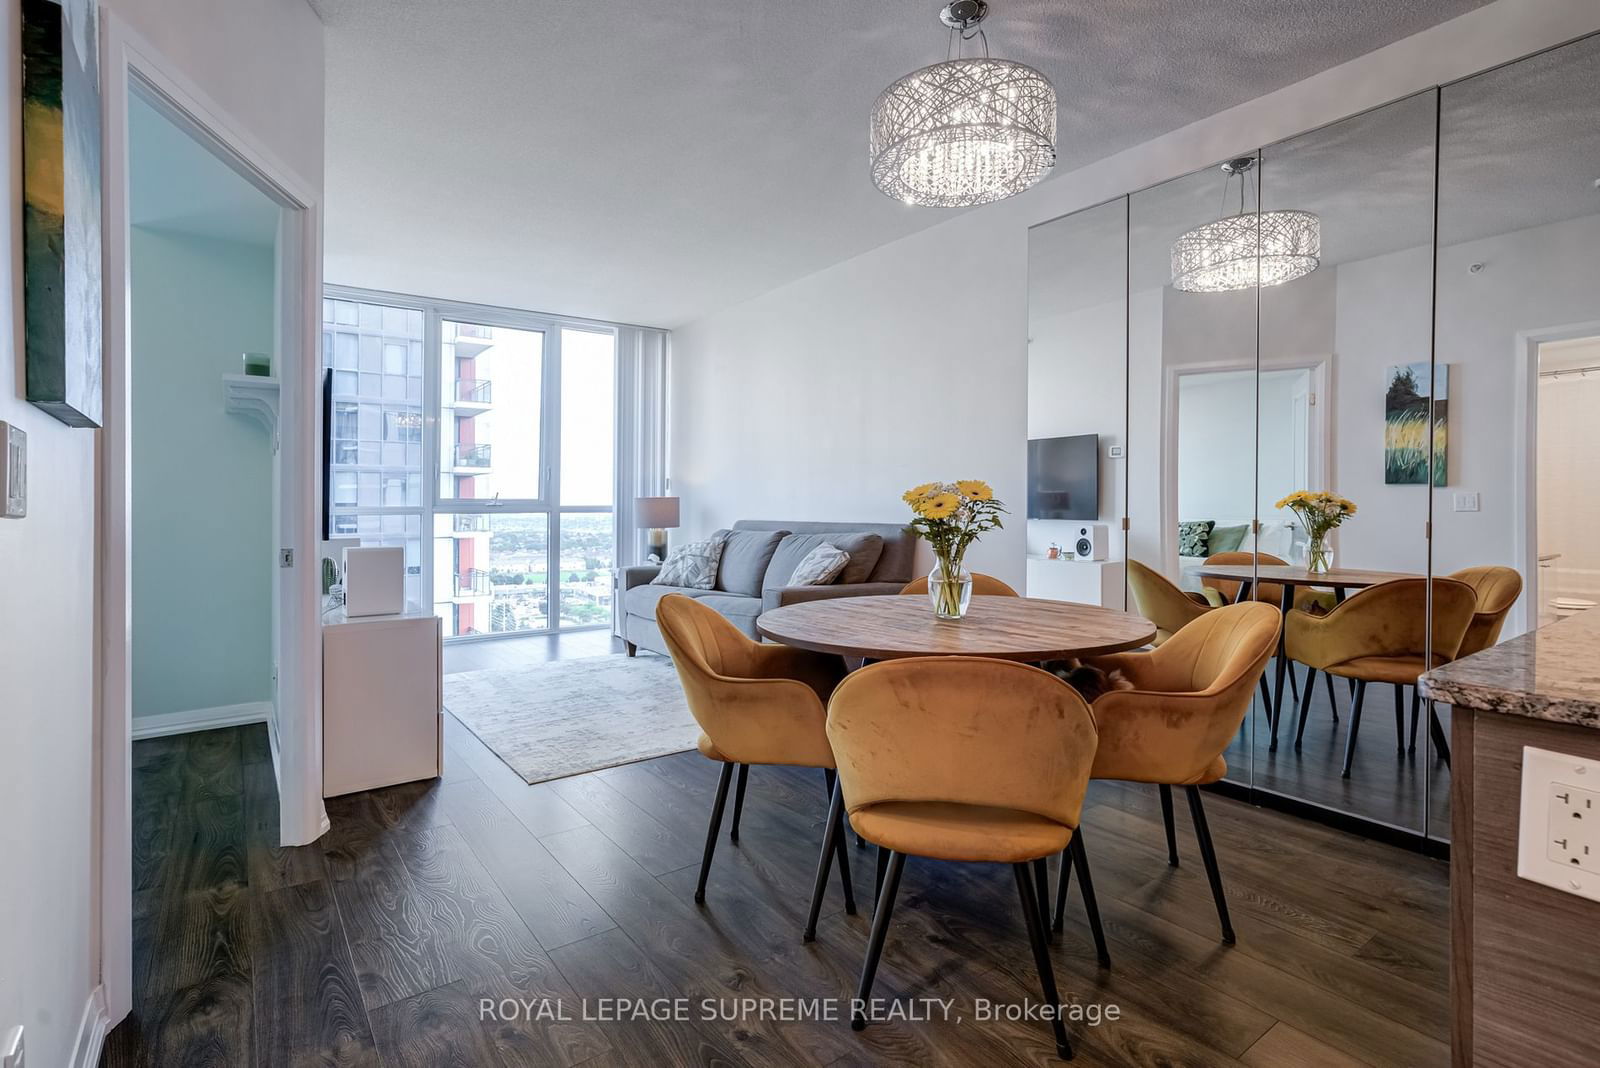
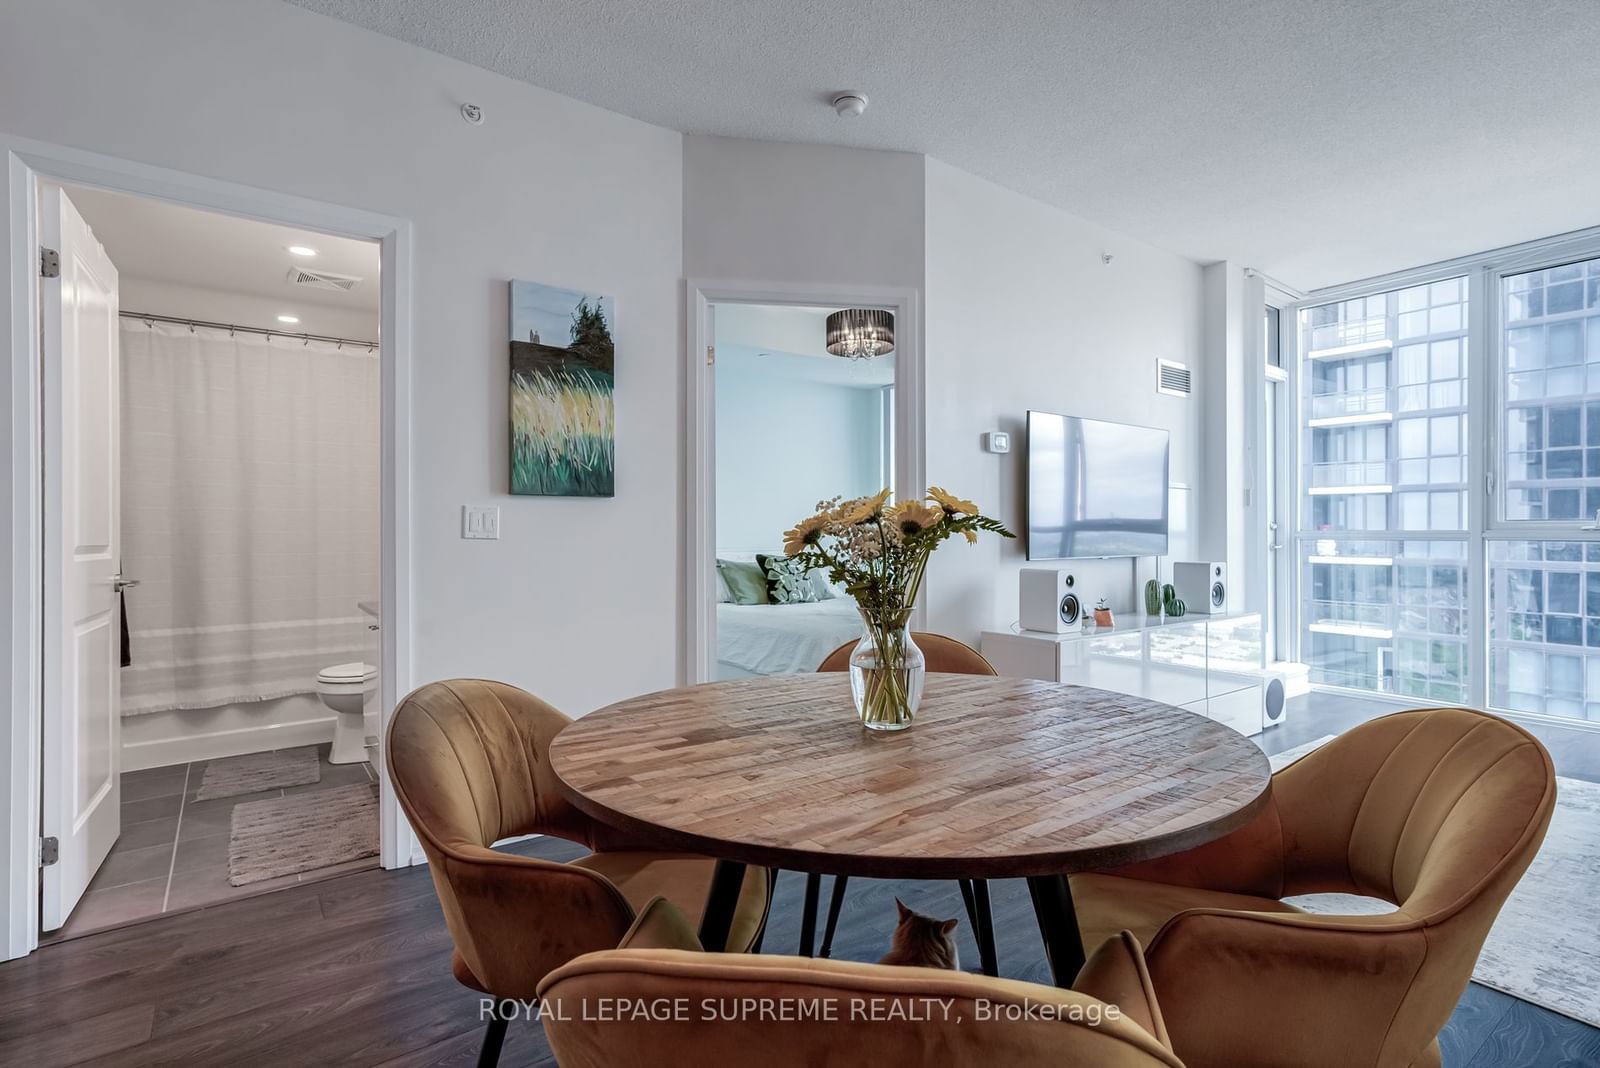
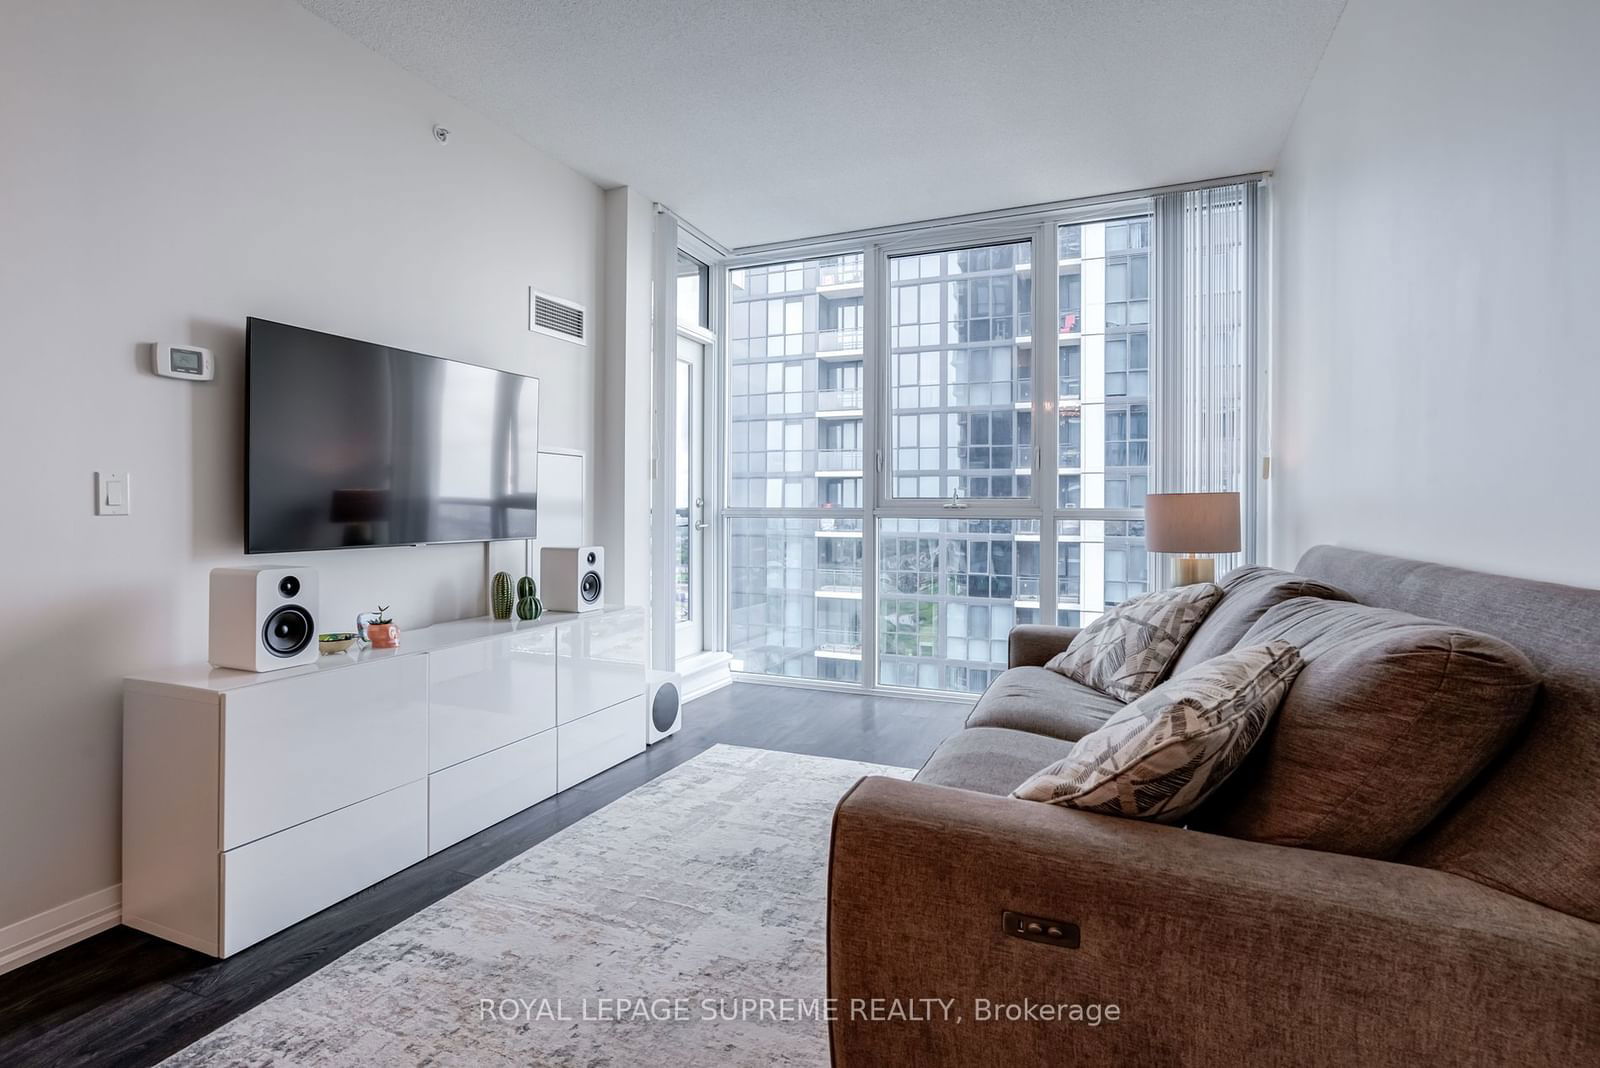
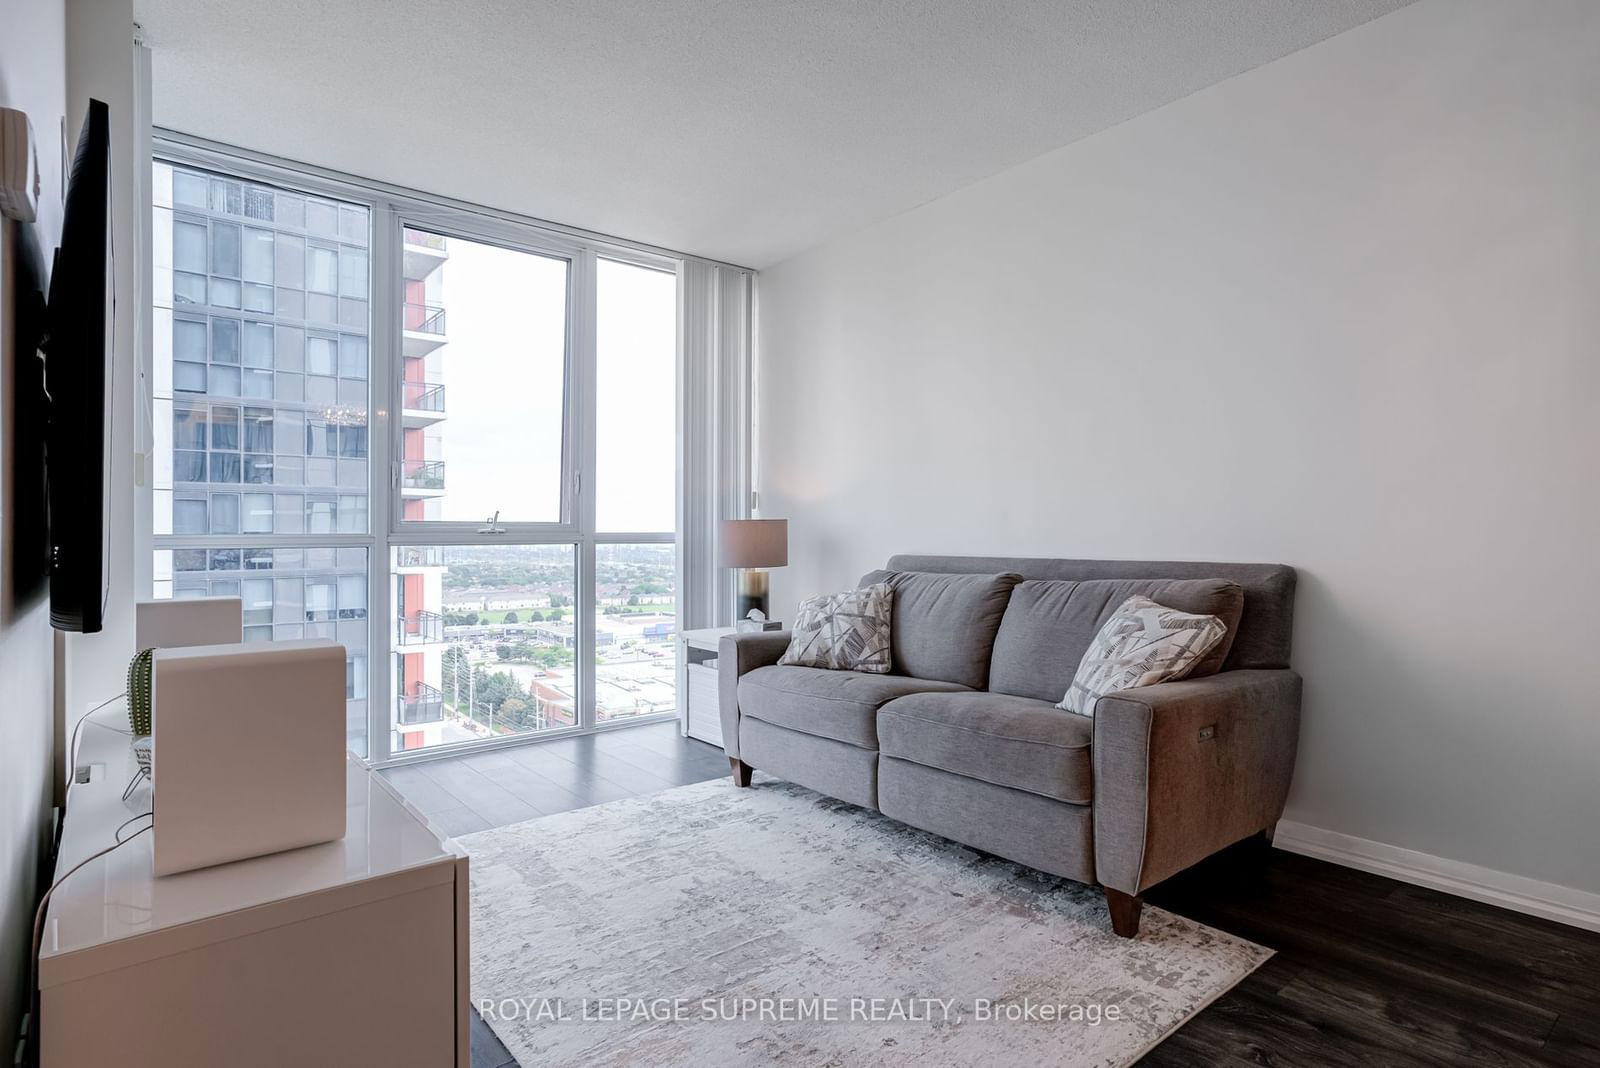
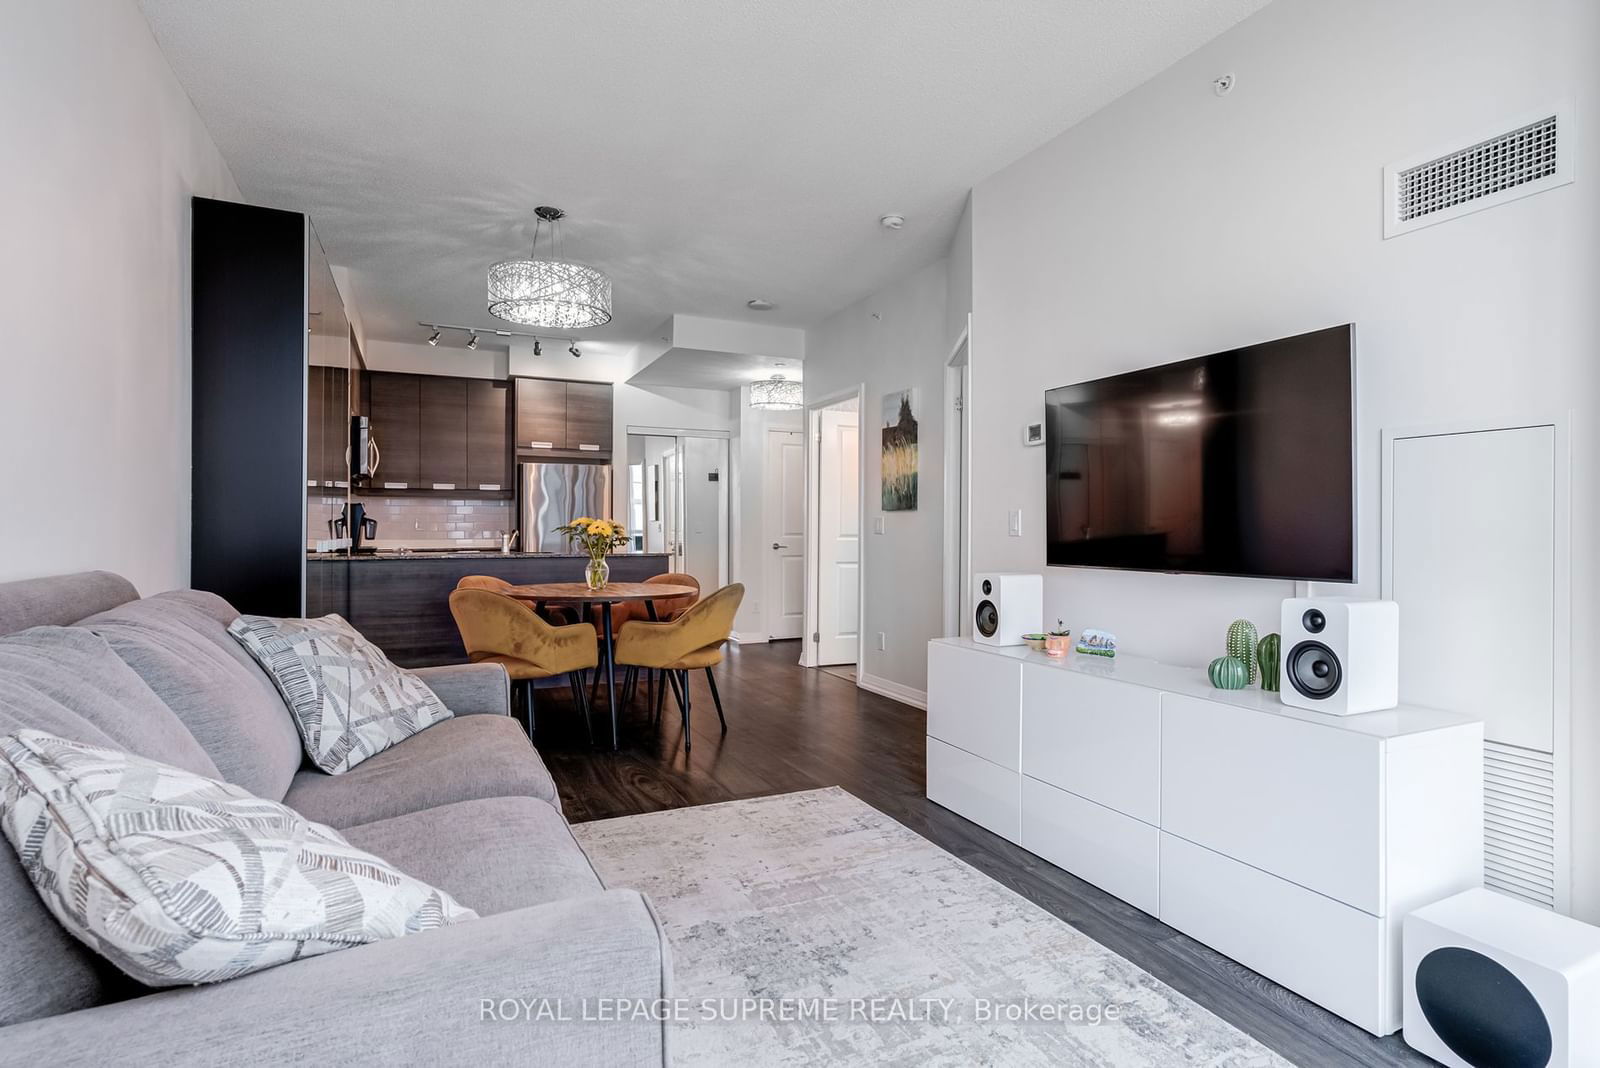
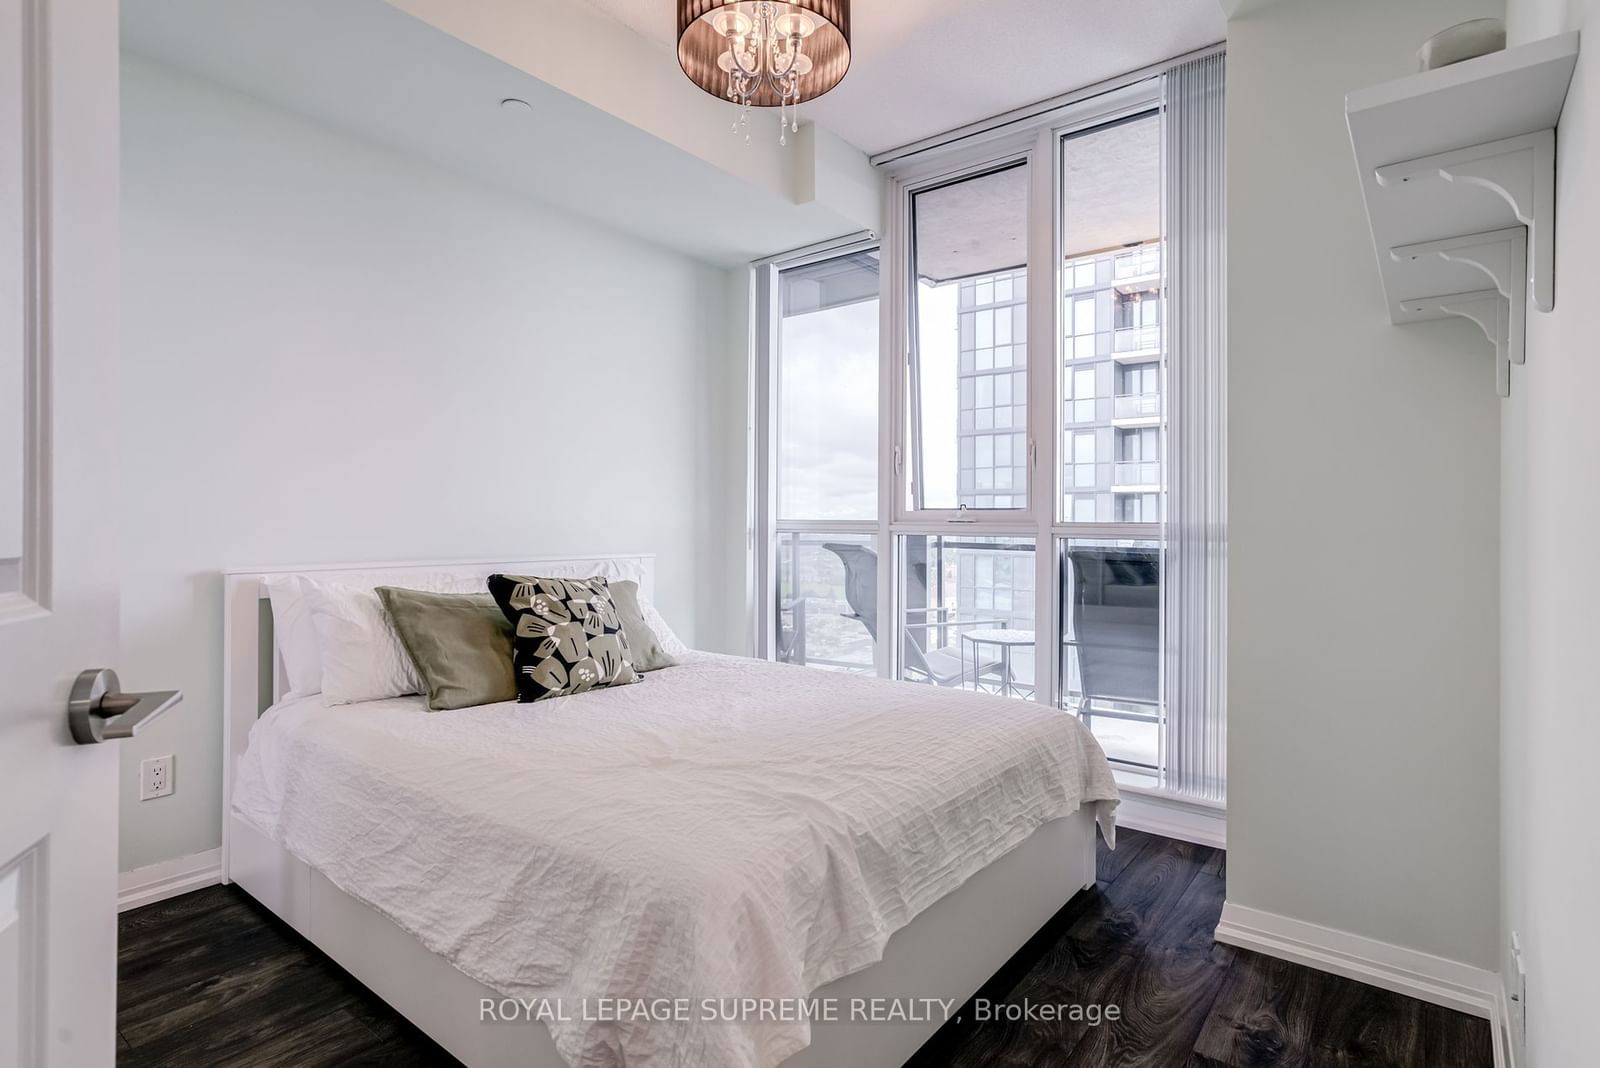
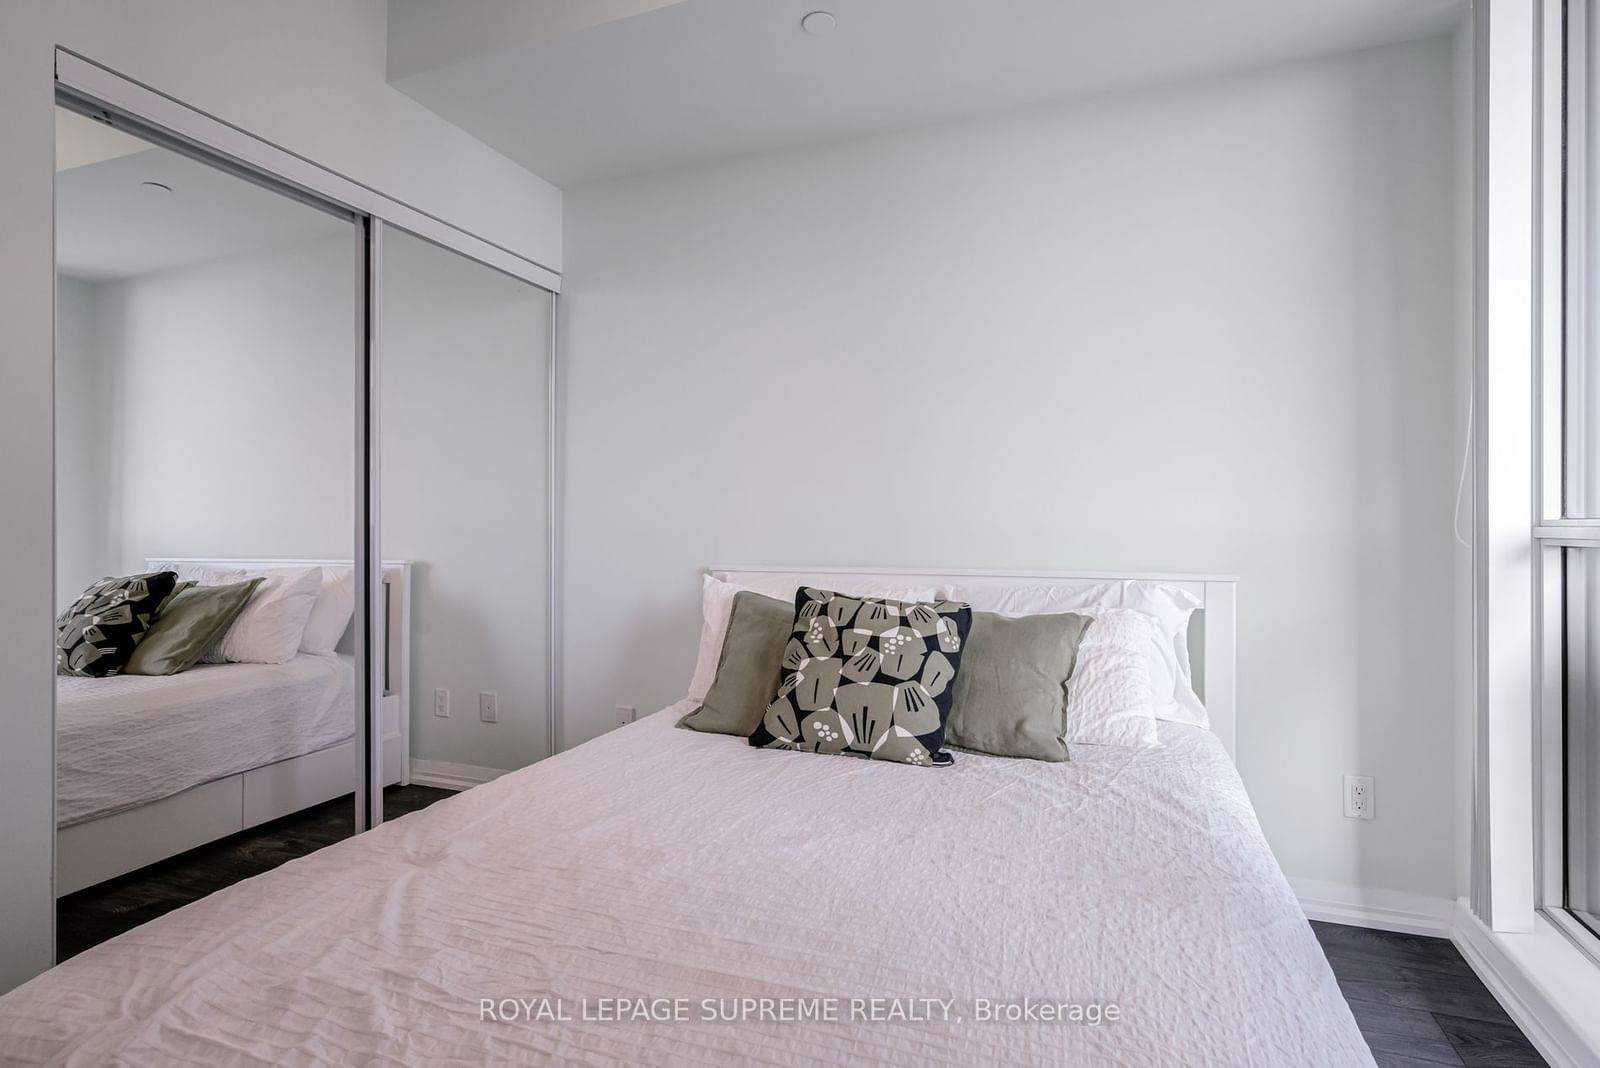
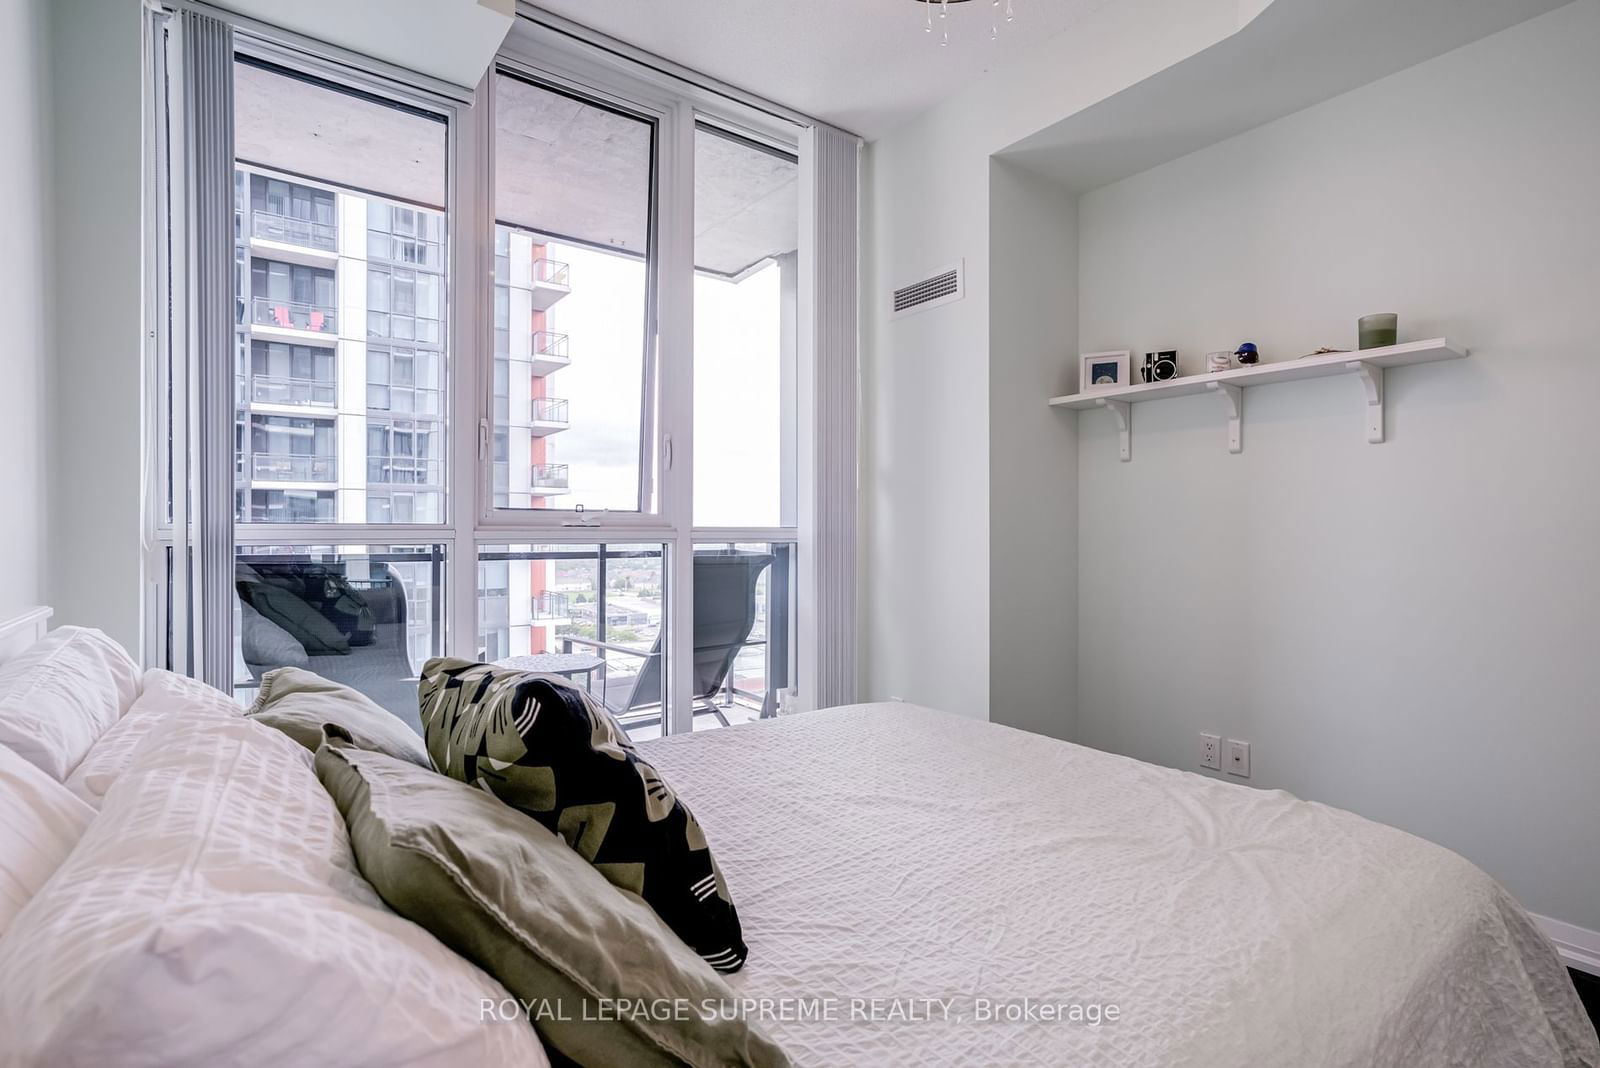
Enjoy this sun filled unit at Pinnacle Uptown, Crystal Tower. Look no further, this 571 sq/ft +balcony unit boasts floor to ceiling windows with a southeast exposure that brightens your home allday with views of the Toronto skyline! Enjoy a full kitchen with full-size stainless-steelappliances, full dining area with built in storage unit and a spacious living room with upgradedflooring and light fixtures throughout. Conveniently located minutes away from all major highwaysand the future Mississauga LRT, you are walking distance from Square One Shopping Center, parks,recreation centers, the list goes on. Great Amenities, Pool, Fitness Centre, Guest Suite, Party Rm,Games Rm &More. Don't miss out on this turn key unit!
royal lepage supreme realtyMLS® #W11821614
Amenities
Explore Neighbourhood
Similar Listings
Demographics
Based on the dissemination area as defined by Statistics Canada. A dissemination area contains, on average, approximately 200 – 400 households.
Price Trends
Maintenance Fees
Building Trends At Crystal Condos
Days on Strata
List vs Selling Price
Offer Competition
Turnover of Units
Property Value
Price Ranking
Sold Units
Rented Units
Best Value Rank
Appreciation Rank
Rental Yield
High Demand
Transaction Insights at 55 Eglinton Avenue W
| 1 Bed | 1 Bed + Den | 2 Bed | 2 Bed + Den | 3 Bed | 3 Bed + Den | |
|---|---|---|---|---|---|---|
| Price Range | $545,000 | $510,000 - $588,700 | $705,000 | No Data | $889,000 - $1,150,000 | No Data |
| Avg. Cost Per Sqft | $959 | $943 | $711 | No Data | $621 | No Data |
| Price Range | $2,300 - $2,550 | $2,300 - $2,800 | $2,799 - $3,190 | No Data | $3,900 - $4,000 | $5,000 |
| Avg. Wait for Unit Availability | 103 Days | 24 Days | 46 Days | 313 Days | 168 Days | 105 Days |
| Avg. Wait for Unit Availability | 55 Days | 12 Days | 16 Days | 580 Days | 143 Days | 200 Days |
| Ratio of Units in Building | 11% | 44% | 32% | 3% | 6% | 7% |
Transactions vs Inventory
Total number of units listed and leased in Hurontario
